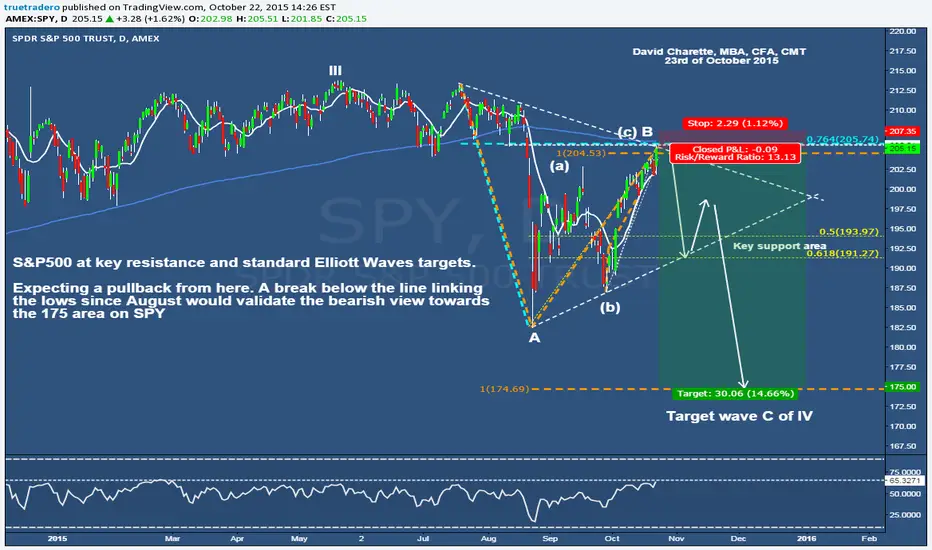
The S&P500 is at key graphical resistance (line linking the tops) and standard Elliott Waves targets.
RSI-14 Daily is at resistance also.
A break below the line linking the lows since August would validate the bearish count towards the 175 area on SPY.
A daily close above 207.35 would invalidate this view.
RSI-14 Daily is at resistance also.
A break below the line linking the lows since August would validate the bearish count towards the 175 area on SPY.
A daily close above 207.35 would invalidate this view.
免責聲明
這些資訊和出版物並不意味著也不構成TradingView提供或認可的金融、投資、交易或其他類型的意見或建議。請在使用條款閱讀更多資訊。