📈 1-Week Performance
Over the past week, the stock has appreciated by 1.51%
📊 Key Metrics
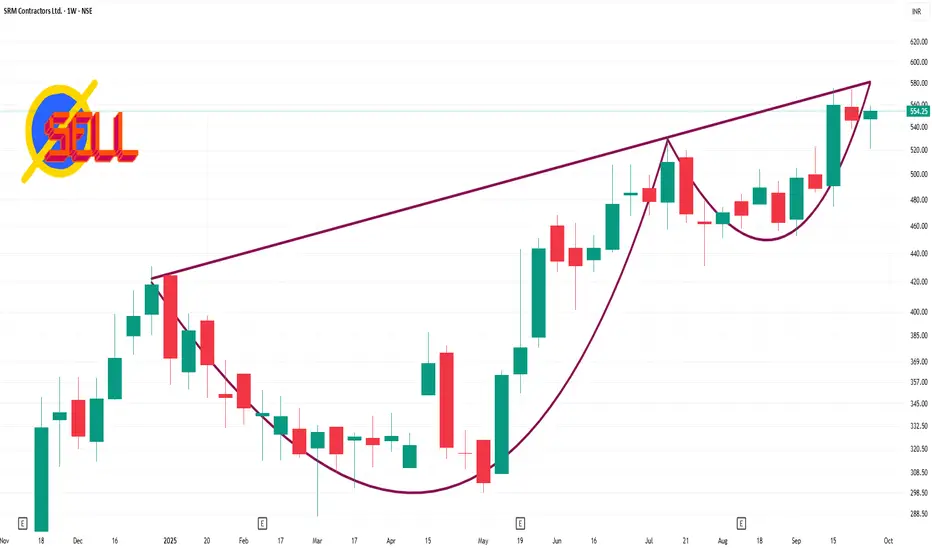
52-Week High: ₹575.20
52-Week Low: ₹246.00
Market Cap: Approximately ₹1,272 crore
P/E Ratio: 19.63
P/B Ratio: 4.5
The stock is currently trading above its 50-day and 200-day Simple Moving Averages, indicating a bullish trend.
🔍 Technical Outlook
The stock's current price above both the 50-day and 200-day SMAs indicates a bullish trend. The RSI suggests that the stock is in a neutral zone, neither overbought nor oversold, which could imply room for further upside. However, investors should monitor for any signs of overbought conditions or significant resistance levels near the 52-week high of ₹575.20.
Over the past week, the stock has appreciated by 1.51%
📊 Key Metrics
52-Week High: ₹575.20
52-Week Low: ₹246.00
Market Cap: Approximately ₹1,272 crore
P/E Ratio: 19.63
P/B Ratio: 4.5
The stock is currently trading above its 50-day and 200-day Simple Moving Averages, indicating a bullish trend.
🔍 Technical Outlook
The stock's current price above both the 50-day and 200-day SMAs indicates a bullish trend. The RSI suggests that the stock is in a neutral zone, neither overbought nor oversold, which could imply room for further upside. However, investors should monitor for any signs of overbought conditions or significant resistance levels near the 52-week high of ₹575.20.
相關出版品
免責聲明
這些資訊和出版物並不意味著也不構成TradingView提供或認可的金融、投資、交易或其他類型的意見或建議。請在使用條款閱讀更多資訊。