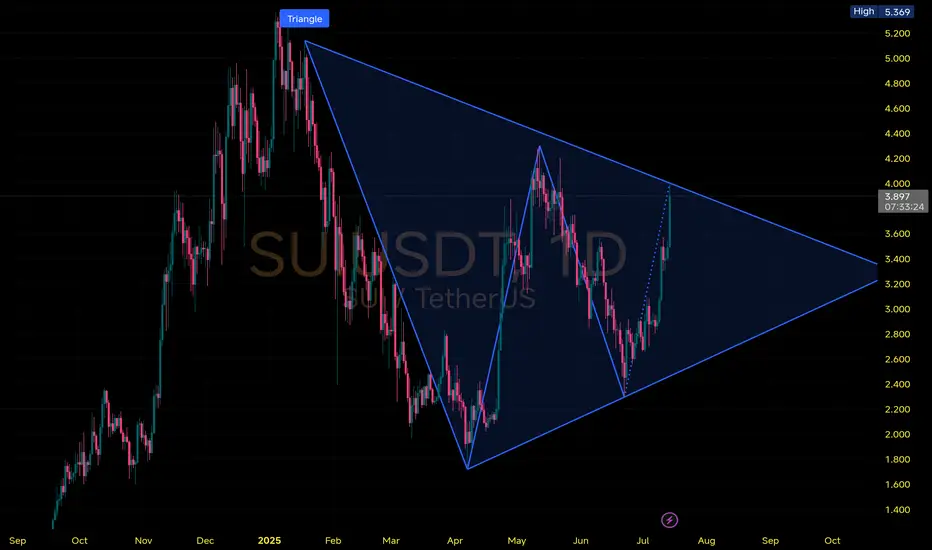
Price is tightening within a large symmetrical triangle pattern on the 1D chart, signaling a major move brewing in the coming weeks.
🔹Price currently pushing toward upper trendline resistance near $4.00
🔸Upside Potential: Break above $4.20 could trigger a rally toward $5.00–$5.30+
🔹Pattern target (if breakout confirmed): roughly $6.00+ based on pole height
🔸Support at $3.20 is key triangle base
🔹Breakdown below = bearish continuation risk toward $2.50
#SUI is coiling within a triangle. A breakout is imminent — watch closely for a decisive move above or below structure.
免責聲明
這些資訊和出版物並非旨在提供,也不構成TradingView提供或認可的任何形式的財務、投資、交易或其他類型的建議或推薦。請閱讀使用條款以了解更多資訊。
免責聲明
這些資訊和出版物並非旨在提供,也不構成TradingView提供或認可的任何形式的財務、投資、交易或其他類型的建議或推薦。請閱讀使用條款以了解更多資訊。