Technical Overview
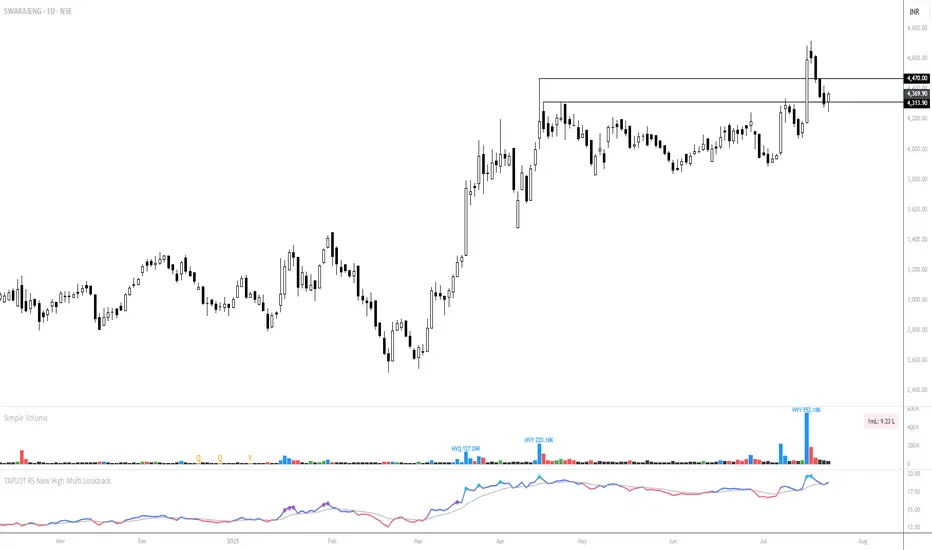
Trend: The chart shows a clear upward trend since early 2025. The price consolidated in a tight range for several months before breaking out convincingly.
Breakout: The breakout coincided with a notable spike in volume, indicating strong participation, likely due to robust earnings.
Current Price Action: After the breakout above the 4,313–4,350 resistance zone, the stock surged to fresh highs and is now pulling back, retesting the breakout zone as support.
Technical Setup
Support Levels:
4,350: Recent breakout level, now serving as immediate support.
4,313: Lower boundary of the support zone.
Resistance:
4,490 is the upper part of the breakout zone and the next resistance on upside moves.
Recent high (~4,700): Psychological and technical resistance.
Moving Averages: Price remains above the clustered short-term EMAs, supporting bullish sentiment.
Volume: Heavy buy volume on breakout; lighter volume during the pullback—suggesting selling pressure is mild so far.
Momentum (RSI/TA indicator): Still above the midline, positive but not overbought.
Action Plan
Bullish Scenario:
If price stabilizes and bounces off the 4,313–4,350 support zone—watch for bullish reversal candlesticks (e.g., hammer, bullish engulfing).
Entry: Consider long positions if the stock holds above 4,350 with a clear up-day and renewed volume.
Bearish Scenario:
If price breaks and closes below 4,313 on high volume, expect a deeper retracement (watch for next EMA or previous swing lows as possible supports).
Action: Consider tightening stops or reducing long exposure if the support fails.
Neutral/Wait-and-Watch:
If the price moves sideways or in a tight range near support, wait for clear resolution—either a decisive bounce or breakdown.
免責聲明
這些資訊和出版物並不意味著也不構成TradingView提供或認可的金融、投資、交易或其他類型的意見或建議。請在使用條款閱讀更多資訊。
免責聲明
這些資訊和出版物並不意味著也不構成TradingView提供或認可的金融、投資、交易或其他類型的意見或建議。請在使用條款閱讀更多資訊。
