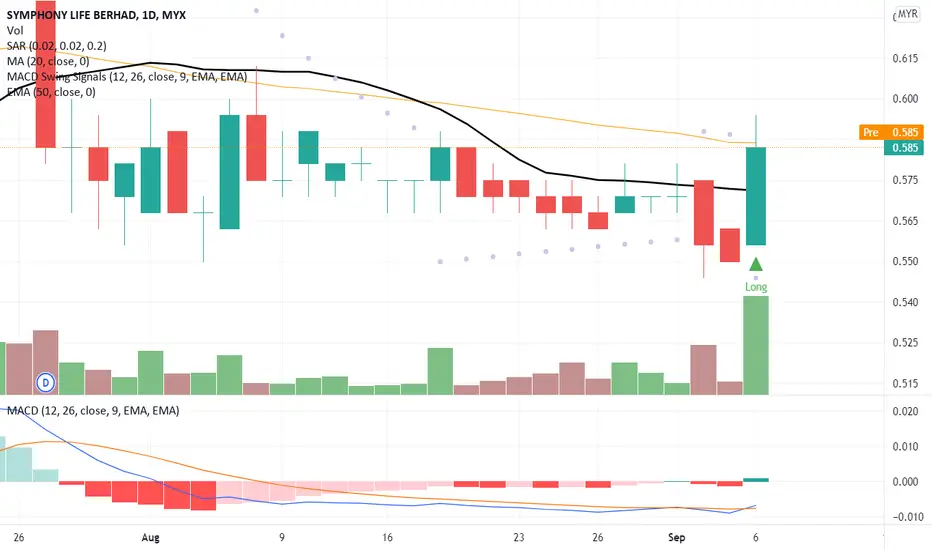
The chart shows an engulfing candle and mark of T0 with support of high volume. Will today the body candle cross up MA50? The probability of changes is high because MACD line is a cross-up signal line in the MACD chart.
R 0.600
S 0.550
R 0.600
S 0.550
免責聲明
這些資訊和出版物並不意味著也不構成TradingView提供或認可的金融、投資、交易或其他類型的意見或建議。請在使用條款閱讀更多資訊。
免責聲明
這些資訊和出版物並不意味著也不構成TradingView提供或認可的金融、投資、交易或其他類型的意見或建議。請在使用條款閱讀更多資訊。