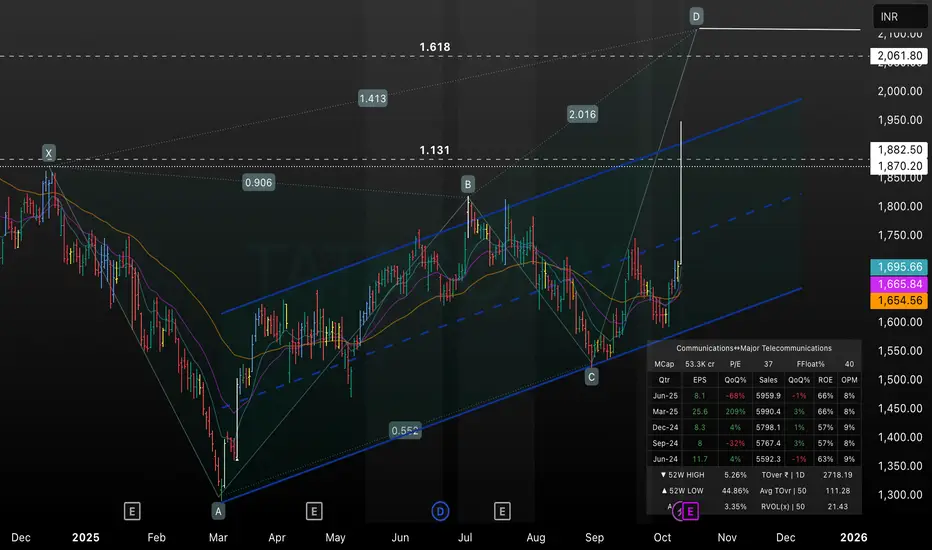
This TradingView chart analyzes TATA Communications (TATACOM) bullish price action as of October 2025, showcasing a breakout from a multi-month ascending channel. Key Fibonacci extension targets (1.131, 1.413, 1.618) are plotted for projected moves toward ₹2,061.80, with support and resistance levels derived from price swings and channel boundaries. The chart highlights rapid momentum following a pivot from point C, using multi-timeframe EMA overlays and ATR bands for confirmation. Major metrics, including market cap, P/E, EPS, and institutional holdings, are summarized for fundamental context. This technical setup is ideal for traders seeking actionable breakout and retracement levels in TATACOM using advanced charting and precision risk management strateg
免責聲明
這些資訊和出版物並不意味著也不構成TradingView提供或認可的金融、投資、交易或其他類型的意見或建議。請在使用條款閱讀更多資訊。
免責聲明
這些資訊和出版物並不意味著也不構成TradingView提供或認可的金融、投資、交易或其他類型的意見或建議。請在使用條款閱讀更多資訊。