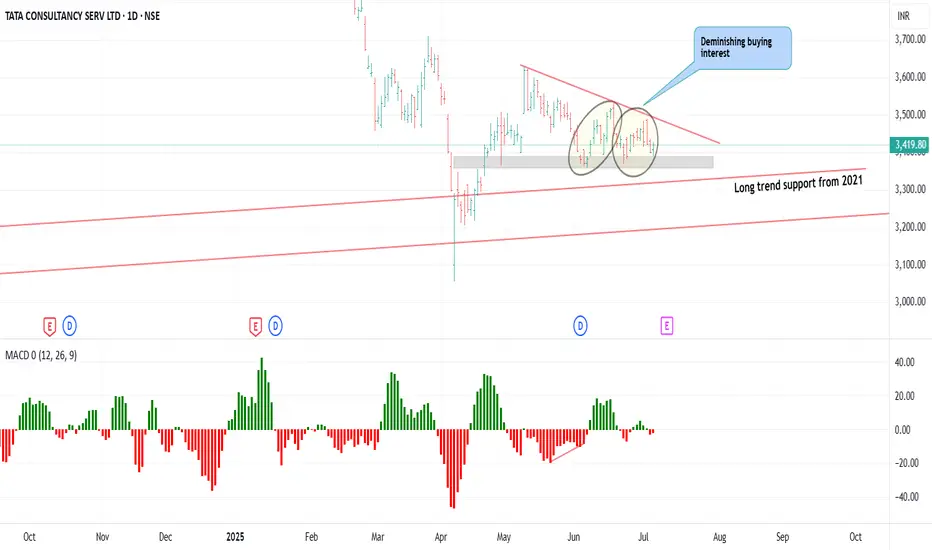
TCS 3419 is showing a descending triangle pattern.
Buying interest diminishing could be seen in the chart.
3480 is resistance and 3362 is support.
Signals suggest possible short weakness drop to support and then reverse to resistance
Day PCR is bearish at 0.74 while intraday at 2.34 suggests long buildup.
PUT premiums are higher than Call Premium suggests a shakeout is possible to trap the PUT writers.
免責聲明
The information and publications are not meant to be, and do not constitute, financial, investment, trading, or other types of advice or recommendations supplied or endorsed by TradingView. Read more in the Terms of Use.
免責聲明
The information and publications are not meant to be, and do not constitute, financial, investment, trading, or other types of advice or recommendations supplied or endorsed by TradingView. Read more in the Terms of Use.