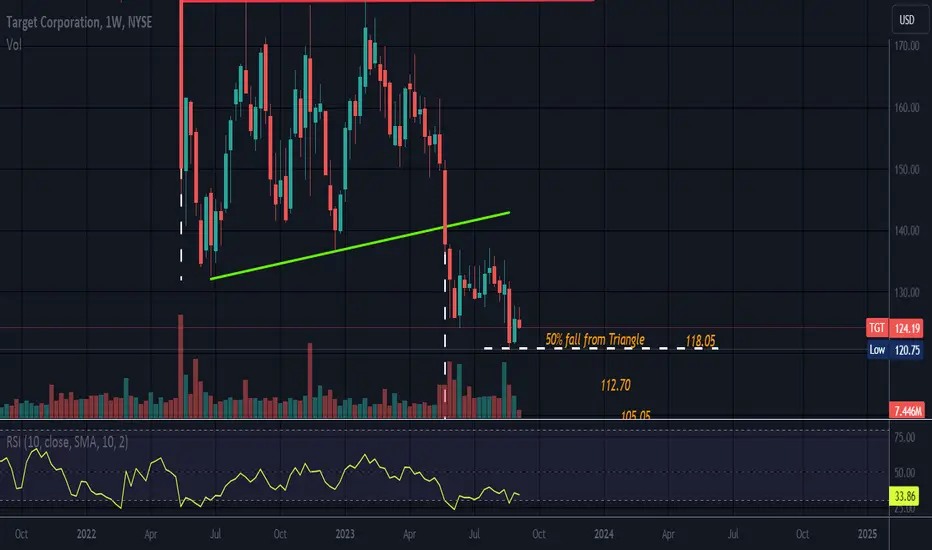
Looks like an Ascending Triangle o the weekly timeframe.
All triangles are neutral until broken. This Ascending Triangle has broken to the downside.
Targets in orange and were calculated using the wide end and fib levels.
Price has hit the 50% mark. The next target is the .618, then the .786 then 100%.
Price can fall less or more than 100%. T1 which was the .382 has been passed.
No recommendation.
If one does not see a pattern on daily, sometimes there is one on weekly.
The green line should be red as prior support is now resistance.
免責聲明
這些資訊和出版物並非旨在提供,也不構成TradingView提供或認可的任何形式的財務、投資、交易或其他類型的建議或推薦。請閱讀使用條款以了解更多資訊。