🚀
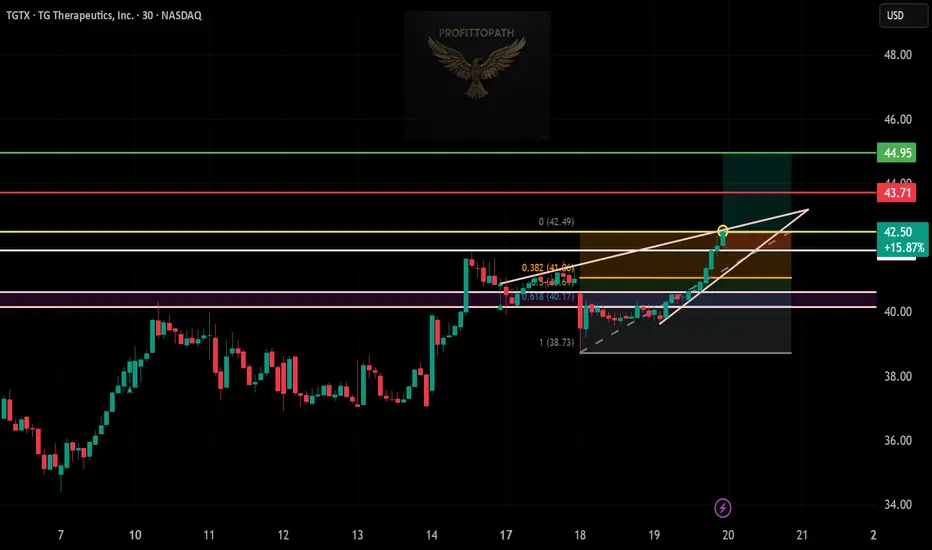
🔹 Asset: TGTX – NASDAQ
🔹 Timeframe: 30-Min Chart
🔹 Setup Type: Bullish Breakout (Rising Wedge & Fibonacci Retracement)
📊 Trade Plan (Long Position)
✅ Entry Zone: Above $42.50 (Breakout Confirmation)
✅ Stop-Loss (SL): Below $40.17 (Key Support Level)
🎯 Take Profit Targets
📌 TP1: $43.71 (Resistance Level)
📌 TP2: $44.95 (Extended Bullish Move)
📊 Risk-Reward Ratio Calculation
📉 Risk (SL Distance):
$42.50 - $40.17 = $2.33 risk per share
📈 Reward to TP1:
$43.71 - $42.50 = $1.21 (1:0.52 R/R)
📈 Reward to TP2:
$44.95 - $42.50 = $2.45 (1:1.05 R/R)
✅ Favorable Risk-Reward Ratio toward TP2
🔍 Technical Analysis & Strategy
📌 Rising Wedge Breakout: Price action is holding above key levels, signaling bullish momentum.
📌 Fibonacci Confluence: The 0.382, 0.5, and 0.618 Fibonacci retracement levels provide strong support.
📌 Volume Confirmation Needed: Look for above-average buying volume above $42.50 to validate the breakout.
📌 Resistance at $43.71: A breakout above this will strengthen the bullish move toward TP2.
📉 Trade Execution & Risk Management
📊 Volume Confirmation: Ensure strong buying volume above $42.50 before entering.
📉 Trailing Stop Strategy: Move SL to break-even ($42.50) after hitting TP1 ($43.71).
💰 Partial Profit Booking Strategy
✔ Take 50% profits at TP1 ($43.71), let the rest run toward TP2 ($44.95).
✔ Adjust Stop-Loss to Break-even ($42.50) after TP1 is reached.
⚠️ Risks & Considerations
❌ Fake Breakout Risk: If the price fails to hold above $42.50, exit early.
❌ Confirmation Required: Wait for a 30-min candle close above $42.50 before entering.
🚀 Final Thoughts
✔ Bullish Setup – Strong upside potential.
✔ Momentum Shift Possible – Watch for volume confirmation.
✔ Favorable Risk-Reward Ratio – 1:1.05 toward TP2.
💡 Stick to the plan, manage risk, and trade smart! 🚀📈
🔗 #TGTX #NASDAQ #LongTrade #TradingView #ProfittoPath 💰📊
免責聲明
這些資訊和出版物並不意味著也不構成TradingView提供或認可的金融、投資、交易或其他類型的意見或建議。請在使用條款閱讀更多資訊。
免責聲明
這些資訊和出版物並不意味著也不構成TradingView提供或認可的金融、投資、交易或其他類型的意見或建議。請在使用條款閱讀更多資訊。