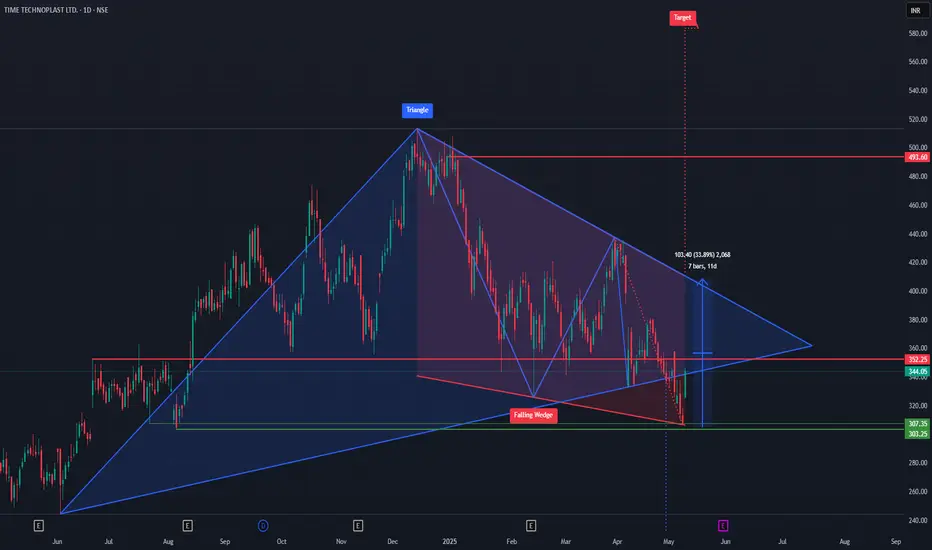
Chart Pattern Combo: 🔻 Falling Wedge inside 🔺 Symmetrical Triangle
CMP: ₹344 | Target: ₹493 (43% Upside)
📈 What’s Happening?
This setup is a classic case of pattern convergence — where price action + psychology meet:
🔹 Symmetrical Triangle → Signals price is coiling and preparing for a breakout
🔹 Falling Wedge Breakout → A bullish reversal pattern, already active
🔹 Strong Bounce from demand zone ₹303–₹307 confirms buyer interest
🔹 Immediate resistance at ₹352 — a breakout above this could trigger fast upside
🔍 Smart Money Clues:
Institutions love to accumulate in silence — this double-pattern setup signals exactly that:
Consolidation = accumulation
Volume drying up during downtrend = typical of wedge
Sharp upside candle = ignition point
🎯 Trade Plan:
Breakout Confirmation: Above ₹352
Entry Zone: ₹340–₹352 (aggressive), ₹307–₹320 (if retest happens)
Target 1: ₹420 Target 2: ₹493
Stop Loss: Below ₹303 (daily close)
What do you think — is this about to explode out of compression?
Comment your view 👇🔥
#TimeTechnoplast #TechnicalAnalysis #FallingWedge #BreakoutStocks #SymmetricalTriangle #ChartSetup #PositionalTrading #PriceAction
註釋
Booked some! LOW RISK? PLAY HUGE!
Follow for latest updates and valuable financial content
✆ t.me/iVishalPal
Yt: t.ly/frb4G
LinkedIn: t.ly/g_SjB
WhatsApp: t.ly/_6T9j
TradingView: t.ly/-UGgZ
Telegram: t.me/traderpulseyt
Follow for latest updates and valuable financial content
✆ t.me/iVishalPal
Yt: t.ly/frb4G
LinkedIn: t.ly/g_SjB
WhatsApp: t.ly/_6T9j
TradingView: t.ly/-UGgZ
Telegram: t.me/traderpulseyt
免責聲明
這些資訊和出版物並非旨在提供,也不構成TradingView提供或認可的任何形式的財務、投資、交易或其他類型的建議或推薦。請閱讀使用條款以了解更多資訊。
LOW RISK? PLAY HUGE!
Follow for latest updates and valuable financial content
✆ t.me/iVishalPal
Yt: t.ly/frb4G
LinkedIn: t.ly/g_SjB
WhatsApp: t.ly/_6T9j
TradingView: t.ly/-UGgZ
Telegram: t.me/traderpulseyt
Follow for latest updates and valuable financial content
✆ t.me/iVishalPal
Yt: t.ly/frb4G
LinkedIn: t.ly/g_SjB
WhatsApp: t.ly/_6T9j
TradingView: t.ly/-UGgZ
Telegram: t.me/traderpulseyt
免責聲明
這些資訊和出版物並非旨在提供,也不構成TradingView提供或認可的任何形式的財務、投資、交易或其他類型的建議或推薦。請閱讀使用條款以了解更多資訊。