看多
TNTBTC - potential breakout opportunity (updated chart)
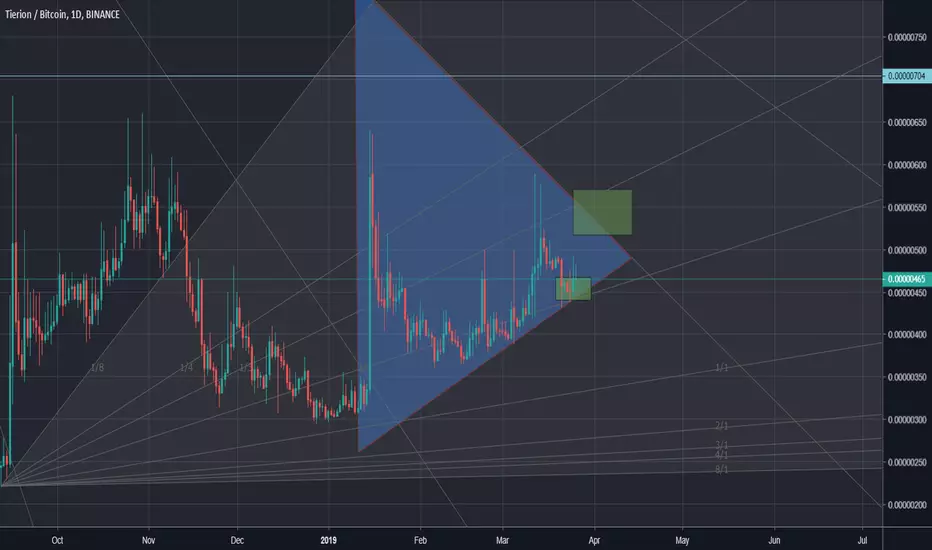
Blue triangle indicates the current range.
Green box is buy.
Red box is sell.
Blue line indicates major resistance.
TNTBTC has the potential to breakout towards the resistance line if a daily candle closes in the 550 area.
Target 1: 700
Target 2 (if the resistance line and the next fib line are broken (ie: daily close above 750)): 1050
Green box is buy.
Red box is sell.
Blue line indicates major resistance.
TNTBTC has the potential to breakout towards the resistance line if a daily candle closes in the 550 area.
Target 1: 700
Target 2 (if the resistance line and the next fib line are broken (ie: daily close above 750)): 1050
免責聲明
這些資訊和出版物並不意味著也不構成TradingView提供或認可的金融、投資、交易或其他類型的意見或建議。請在使用條款閱讀更多資訊。