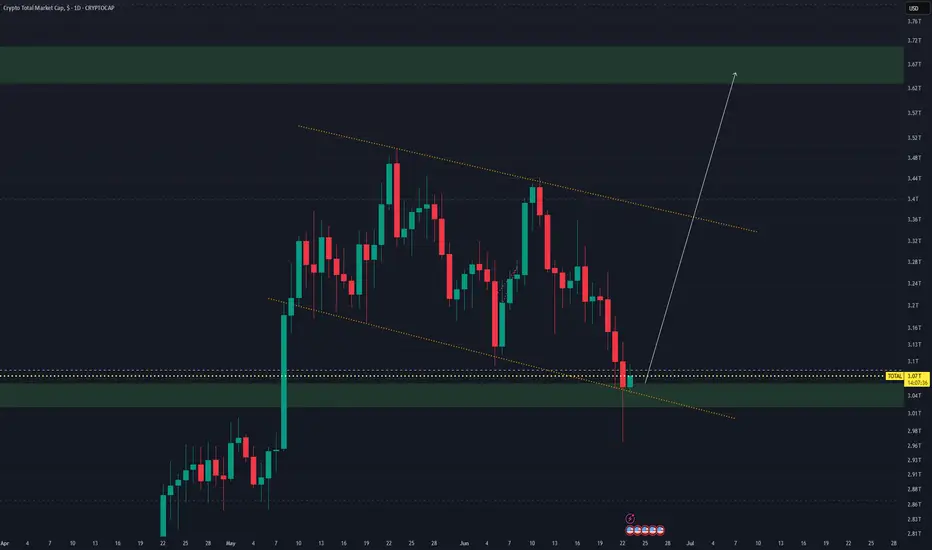
The current chart of TOTAL (total cryptocurrency market capitalization) presents a compelling bullish setup. Price action has formed a falling channel pattern, which is often a bullish continuation/reversal indicator when observed after a prior uptrend — as seen in the earlier impulsive rally.
At present, the market cap has reached a significant demand zone around $3.04T–$3.07T, aligning with both:
- A key horizontal support level (highlighted by the white dashed line), and
- The lower boundary of the descending channel (marked with orange trendlines).
Notably, there was a strong wick rejection to the downside, indicating buyer interest and defense of this support zone. The chart suggests that this area has acted as a springboard for accumulation, and may catalyze a reversal breakout.
The projected move is a rally toward the upper green resistance zone, which lies between $3.62T to $3.70T — a previously established supply zone. The clean and aggressive white arrow illustrates a bullish trajectory that could reflect the next major leg up, should this bounce materialize into a breakout above the channel.
This scenario is further supported by:
- Strong confluence of support levels.
- A complete and respected descending channel structure.
- Positive market sentiment re-entering at macro-cap levels.
Key Levels:
- Support Zone: $3.04T – $3.07T
- Resistance Zone (Target): $3.62T – $3.70T
- Pattern: Descending Channel (Bullish Reversal Potential)
- Risk: Breakdown below $3.00T would invalidate the setup.
If momentum continues as anticipated, this could mark the beginning of a new bullish expansion phase across the crypto market.
免責聲明
這些資訊和出版物並不意味著也不構成TradingView提供或認可的金融、投資、交易或其他類型的意見或建議。請在使用條款閱讀更多資訊。
免責聲明
這些資訊和出版物並不意味著也不構成TradingView提供或認可的金融、投資、交易或其他類型的意見或建議。請在使用條款閱讀更多資訊。
