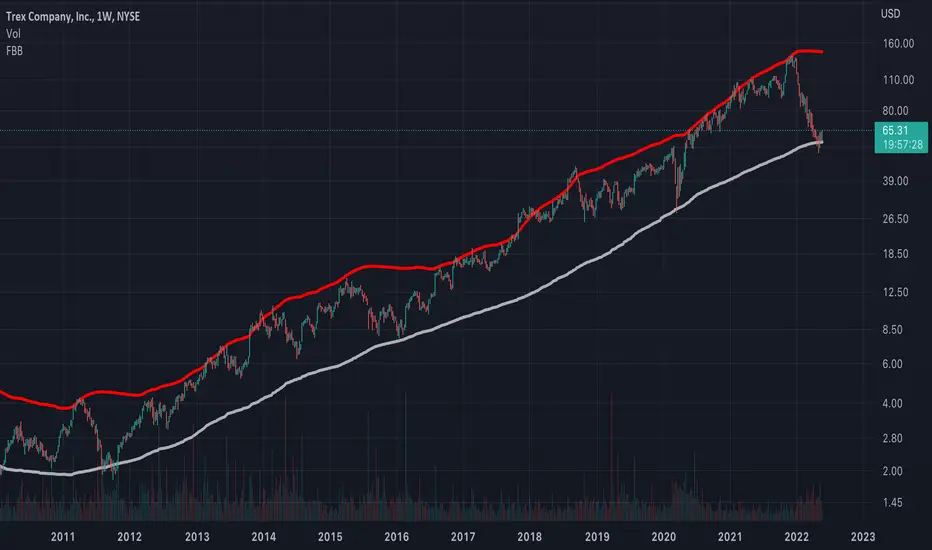
The weekly chart for TREX shows that price appears to remain bounded by the upper band (red) and basis (white) of the Fibonacci Bollinger Bands as it has since the Great Recession. The price is looking ready for a bounce. The oscillators are too oversold on the monthly chart to support a high probability that TREX will drop sharply below the white level. Therefore this price area represents a rather low-risk buying setup.
Not financial advice. As always anything can happen and trends can end.
Not financial advice. As always anything can happen and trends can end.
To support my work:
patreon.com/SpyMasterTrades
To subscribe to my YouTube channel:
youtube.com/@SpyMasterTrades
To follow me on X:
twitter.com/SpyMasterTrades
To tip me (BTC wallet):
bc1qvh48429042mdwvdthwlufx072g3ftffcts2q03
patreon.com/SpyMasterTrades
To subscribe to my YouTube channel:
youtube.com/@SpyMasterTrades
To follow me on X:
twitter.com/SpyMasterTrades
To tip me (BTC wallet):
bc1qvh48429042mdwvdthwlufx072g3ftffcts2q03
免責聲明
這些資訊和出版物並不意味著也不構成TradingView提供或認可的金融、投資、交易或其他類型的意見或建議。請在使用條款閱讀更多資訊。