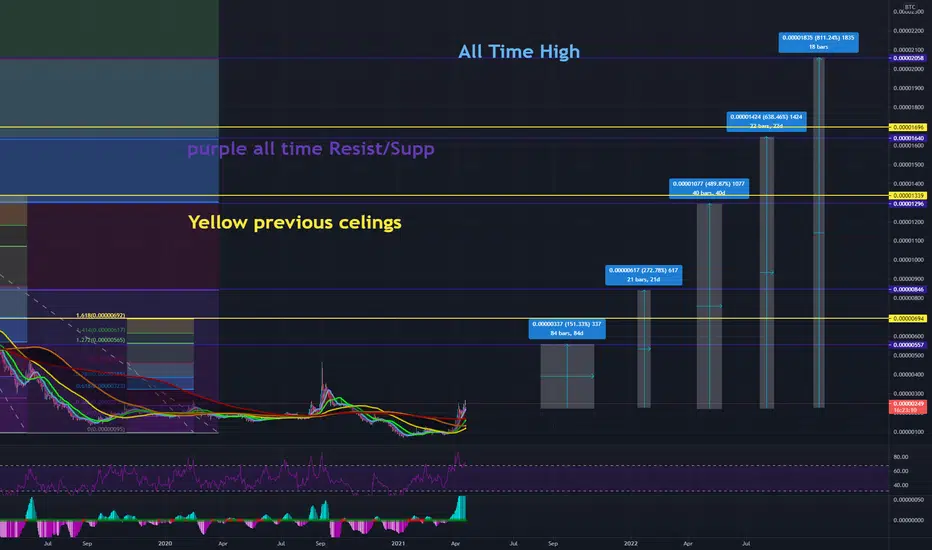
this chart is to see how far TRX can go based on TA. using all time highs, previous peaks as supports and resistance. half posting to see how TRX plays on its own invisible lines
免責聲明
這些資訊和出版物並不意味著也不構成TradingView提供或認可的金融、投資、交易或其他類型的意見或建議。請在使用條款閱讀更多資訊。