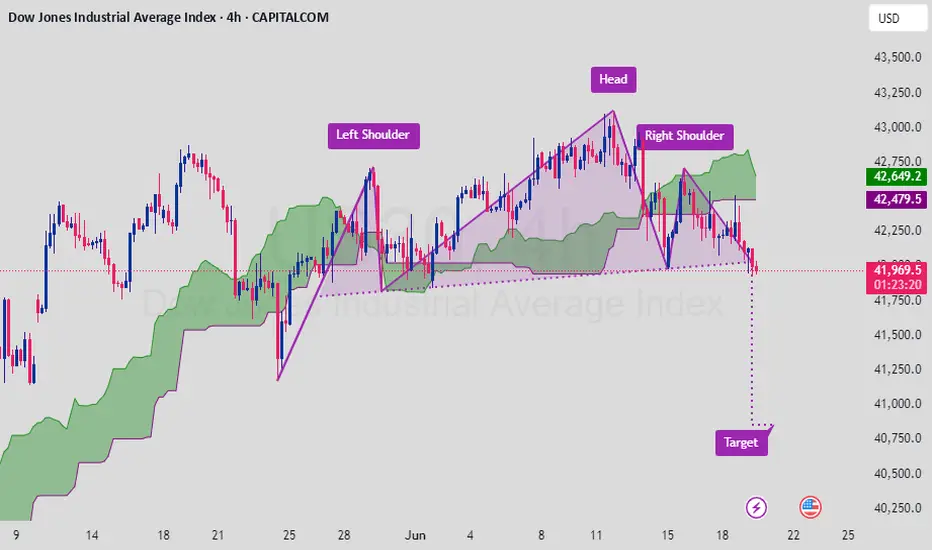
The Dow Jones Industrial Average (DJIA) is displaying a classic Head and Shoulders formation on the 4H chart, suggesting a potential trend reversal. Price has broken below the neckline and is trading below the Ichimoku cloud, signaling growing downside pressure.
🔹 Pattern: Head and Shoulders
🔹 Current Price: ~$41,966
🔹 Breakdown Confirmation Level: ~$42,200 (neckline)
🔹 Target: ~$41,000 based on measured move
🔹 Technical Outlook: Bearish momentum building below neckline and cloud
🔹 Fundamentals: Market cautious ahead of macro data and Fed policy signals
Bearish scenario developing – sustained price action below neckline could accelerate downside move toward target. 📉⚠️
Note :If you found this helpful, like and follow for more trade ideas!
Share My Idea With Your Firends Mention Your Feed back Comment Section
This is not financial advice. Please conduct your own research and manage risk accordingly.
免責聲明
這些資訊和出版物並不意味著也不構成TradingView提供或認可的金融、投資、交易或其他類型的意見或建議。請在使用條款閱讀更多資訊。
免責聲明
這些資訊和出版物並不意味著也不構成TradingView提供或認可的金融、投資、交易或其他類型的意見或建議。請在使用條款閱讀更多資訊。