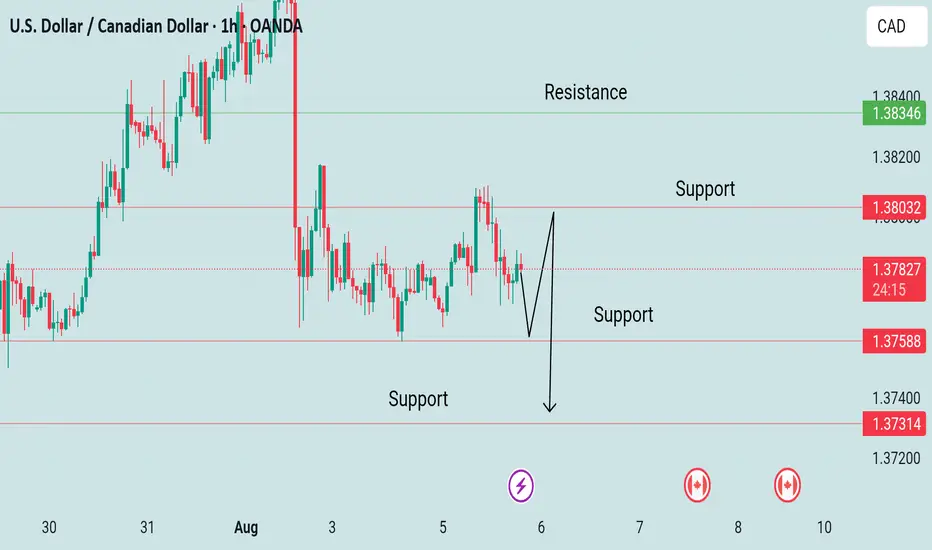
The USD/CAD 1-hour chart you provided shows a range-bound market with clear support and resistance levels. Here’s a breakdown of the analysis:
---
Key Levels:
Resistance: Around 1.38346
Support Zones:
1.38032 (Minor support, now resistance)
1.37588
1.37314 (Stronger support)
---
Current Price:
1.37818, which is in the middle of the current range.
---
Price Action & Pattern:
The chart shows a sideways movement (consolidation) after a downtrend.
There is a drawn projection with two possible scenarios:
1. Bounce from support at 1.37588 → retest of 1.38032
2. Break below 1.37588 → drop to next support at 1.37314
Interpretation
Bullish Scenario
If price bounces from 1.37588, expect a possible move toward 1.38032 or even 1.38346 if bullish momentum builds
Bearish Scenario
If price breaks and closes below 1.37588, we could see a continuation toward 1.37314. A break of that would confirm further downside
Trading Idea
Sell on Breakout:
Below 1.37588, with target 1.37314, and stop above 1.37800
Buy on Bounce
From 1.37588, targeting 1.38032, with stop below 1.37450
Let me know if you want this analysis in Urdu or Sindhi, or need help with a trade setup
---
Key Levels:
Resistance: Around 1.38346
Support Zones:
1.38032 (Minor support, now resistance)
1.37588
1.37314 (Stronger support)
---
Current Price:
1.37818, which is in the middle of the current range.
---
Price Action & Pattern:
The chart shows a sideways movement (consolidation) after a downtrend.
There is a drawn projection with two possible scenarios:
1. Bounce from support at 1.37588 → retest of 1.38032
2. Break below 1.37588 → drop to next support at 1.37314
Interpretation
Bullish Scenario
If price bounces from 1.37588, expect a possible move toward 1.38032 or even 1.38346 if bullish momentum builds
Bearish Scenario
If price breaks and closes below 1.37588, we could see a continuation toward 1.37314. A break of that would confirm further downside
Trading Idea
Sell on Breakout:
Below 1.37588, with target 1.37314, and stop above 1.37800
Buy on Bounce
From 1.37588, targeting 1.38032, with stop below 1.37450
Let me know if you want this analysis in Urdu or Sindhi, or need help with a trade setup
交易進行
Usdcad sell hit 交易結束:目標達成
Usdcad signal sell Target Gold signal
t.me/ProTrader_9
My Channel Link
t.me/ProTrader_9
Check My Performance
t.me/ProTrader_9
My Channel Link
t.me/ProTrader_9
Check My Performance
免責聲明
這些資訊和出版物並不意味著也不構成TradingView提供或認可的金融、投資、交易或其他類型的意見或建議。請在使用條款閱讀更多資訊。
Gold signal
t.me/ProTrader_9
My Channel Link
t.me/ProTrader_9
Check My Performance
t.me/ProTrader_9
My Channel Link
t.me/ProTrader_9
Check My Performance
免責聲明
這些資訊和出版物並不意味著也不構成TradingView提供或認可的金融、投資、交易或其他類型的意見或建議。請在使用條款閱讀更多資訊。
