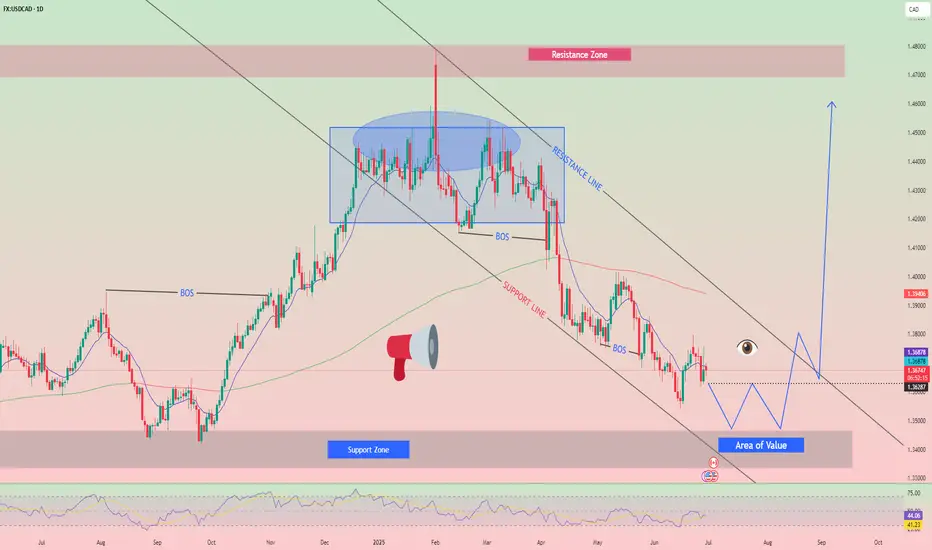
The downward wave that formed on the USD/CAD chart tis year has been followed by a corrective move since late May. The pair is largely confined to a sideways price channel. The current wave structure remains incomplete, lacking final segment.
Forecast:
The pair may decline further in the coming days, reaching the support zone. A reversal and upward movement from support may follow. The resistance zone reflects the upper boundary of the pair's expected weekly volatility.
Potential Reversal Zones
Resistance: 1.3800/ 1.3850
Support: 1.3640/ 1.3590
Recommendations:
Selling: Possible intraday in small volumes, not beyond the support zone.
Buying: Consider only after confirmed reversal signals appear near support.
DAILY FREE SIGNAL. FREE SIGNAL (95% accuracy) TP AND SL PROVIDED
In This Channel, i Will Provide you a profitable Scalping And Swing Trade Follow My Signals
PUBLIC TELEGRAM CHANNEL
t.me/CEO_PREMIUM_ANALYSIS
In This Channel, i Will Provide you a profitable Scalping And Swing Trade Follow My Signals
PUBLIC TELEGRAM CHANNEL
t.me/CEO_PREMIUM_ANALYSIS
免責聲明
這些資訊和出版物並不意味著也不構成TradingView提供或認可的金融、投資、交易或其他類型的意見或建議。請在使用條款閱讀更多資訊。