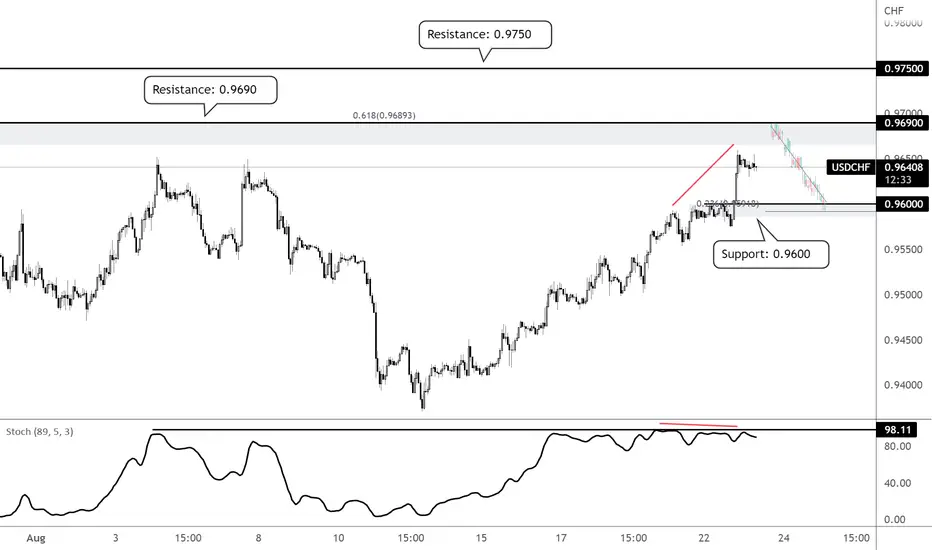
On the H1 time frame, prices are approaching the resistance zone at 0.9690 which lines up with the 61.8% Fibonacci retracement level. We could see a reversal below the 0.9690 resistance zone to our support zone at 0.9600 which is also the graphical support zone and 23.6% Fibonacci retracement. Stochastics is testing resistance at 98.11 as well with a bearish divergence seen as highlighted in red, supporting the bearish bias.
免責聲明
這些資訊和出版物並不意味著也不構成TradingView提供或認可的金融、投資、交易或其他類型的意見或建議。請在使用條款閱讀更多資訊。
免責聲明
這些資訊和出版物並不意味著也不構成TradingView提供或認可的金融、投資、交易或其他類型的意見或建議。請在使用條款閱讀更多資訊。