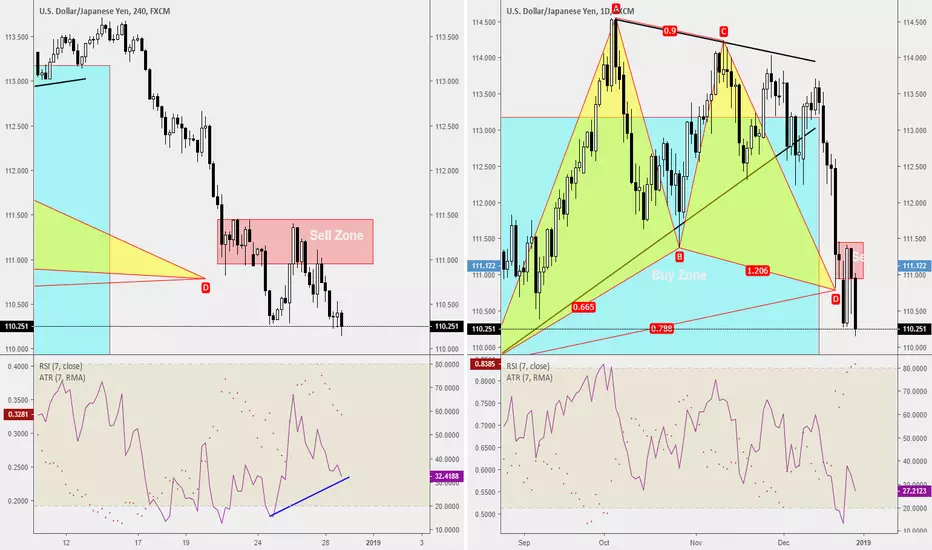
On the Daily Chart(right), the market has fallen straight into the buy zone and beyond the D completion but within X, that will give a better Reward:Risk.
However, on the left(4-hourly chart), the market has formed a new sell zone and that can be a warning signal for bullish traders to look out for. Perhaps a consideration of shifting stops to entry might be a great idea if an indecision candle has appeared within the sell zone.
If you do not wish to miss any more trade ideas, just subscribe to us and please do check out Oct 2018 results that it has given a total of 2,333pips of net profit in a single month.
http://forex100academy.com/tradeideas-oct2018/
🕒 15mins workday for Young Parents
🏦 Qualify Junior Analyst within 90days
🎤 Keynote Speaker
Get into our 15mins workday community
discord.gg/AKDr9vPqH7
Live session & Trading Tips on the GO
instagram.com/raynlim/
🏦 Qualify Junior Analyst within 90days
🎤 Keynote Speaker
Get into our 15mins workday community
discord.gg/AKDr9vPqH7
Live session & Trading Tips on the GO
instagram.com/raynlim/
免責聲明
這些資訊和出版物並不意味著也不構成TradingView提供或認可的金融、投資、交易或其他類型的意見或建議。請在使用條款閱讀更多資訊。