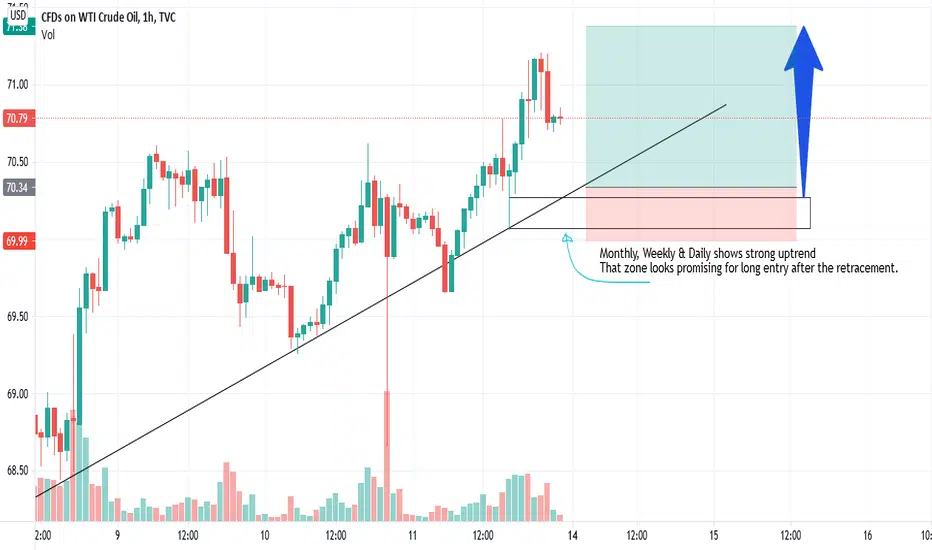
1. The monthly, weekly & daily shows strong up trend.
2. If you get down to 15 minutes chart you will find a clear zone that likely to reflect the price back up.
3. If you used the fixed range volume profile indicator at the last up wave at the 15 minutes chart you will spot a support line right above the zone identified.
4. The trend line as a support.
免責聲明
這些資訊和出版物並不意味著也不構成TradingView提供或認可的金融、投資、交易或其他類型的意見或建議。請在使用條款閱讀更多資訊。
免責聲明
這些資訊和出版物並不意味著也不構成TradingView提供或認可的金融、投資、交易或其他類型的意見或建議。請在使用條款閱讀更多資訊。