### **Technical Analysis of Walchandnagar Industries Ltd. (NSE: WALCHANNAG)**
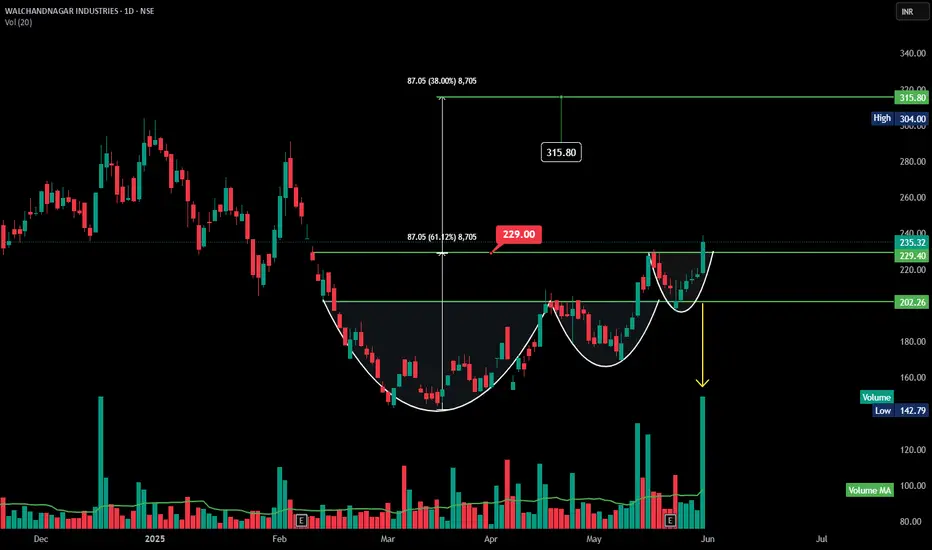
The chart highlights a **cup and handle** pattern, signaling a potential bullish breakout.
### **Key Observations:**
- **Cup Formation:** Extended consolidation phase, indicating accumulation.
- **Handle Formation:** A brief pullback before the breakout, confirming renewed buying interest.
- **Breakout Confirmation:** Price surged above **₹229.00**, now trading at **₹235.32** (+8.30%).
- **Target Price:** **₹315.80**, based on pattern depth, suggesting a **34.2% upside.
### **Indicators to Watch:**
- **Volume:** Significant spike at breakout, confirming strength.
- **RSI:** Above **60**, signals strong momentum.
- **MACD:** Bullish crossover strengthens trend continuation.
- **Support:** **₹229.00** (former resistance turned support).
免責聲明
這些資訊和出版物並不意味著也不構成TradingView提供或認可的金融、投資、交易或其他類型的意見或建議。請在使用條款閱讀更多資訊。
免責聲明
這些資訊和出版物並不意味著也不構成TradingView提供或認可的金融、投資、交易或其他類型的意見或建議。請在使用條款閱讀更多資訊。