Exactly 5 months ago (June 12, see chart below), we gave a strong buy signal on Walmart (WMT) right at the bottom of its trend, which eventually hit our $110 Target and then got rejected:

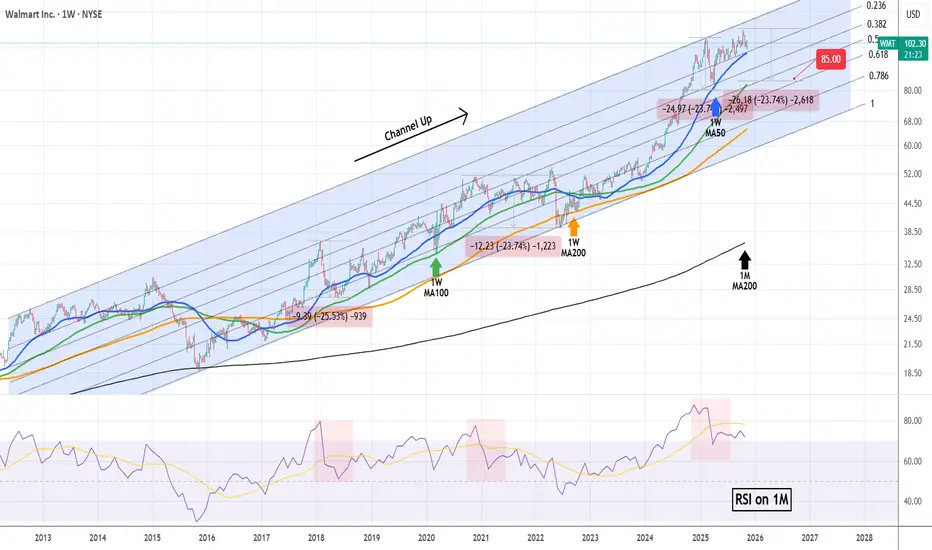
This time we move to the larger 1W time-frame as our former Target was eventually a new All Time High (ATH) almost at the top of the 13-year Channel Up. The price is hanging tightly now on the 1W MA50 (blue trend-line), which is where the previous correction (Feb-March 2025) found Support and rebounded.
With the 1M RSI printing a formation that previous delivered two technical pull-backs of -23.74%, we expect the stock to start correcting again if it closes below the 1W MA50. All previous breaks below it, eventually led to a 1W MA100 (green trend-line) test.
If that takes place, we expect Walmart to hit at least $85.00 inside 2026.
---
** Please LIKE 👍, FOLLOW ✅, SHARE 🙌 and COMMENT ✍ if you enjoy this idea! Also share your ideas and charts in the comments section below! This is best way to keep it relevant, support us, keep the content here free and allow the idea to reach as many people as possible. **
---
💸💸💸💸💸💸
👇 👇 👇 👇 👇 👇
👑Best Signals (Forex/Crypto+70% accuracy) & Account Management (+20% profit/month on 10k accounts)
💰Free Channel t.me/tradingshotglobal
🤵Contact info@tradingshot.com t.me/tradingshot
🔥New service: next X100 crypto GEMS!
💰Free Channel t.me/tradingshotglobal
🤵Contact info@tradingshot.com t.me/tradingshot
🔥New service: next X100 crypto GEMS!
免責聲明
The information and publications are not meant to be, and do not constitute, financial, investment, trading, or other types of advice or recommendations supplied or endorsed by TradingView. Read more in the Terms of Use.