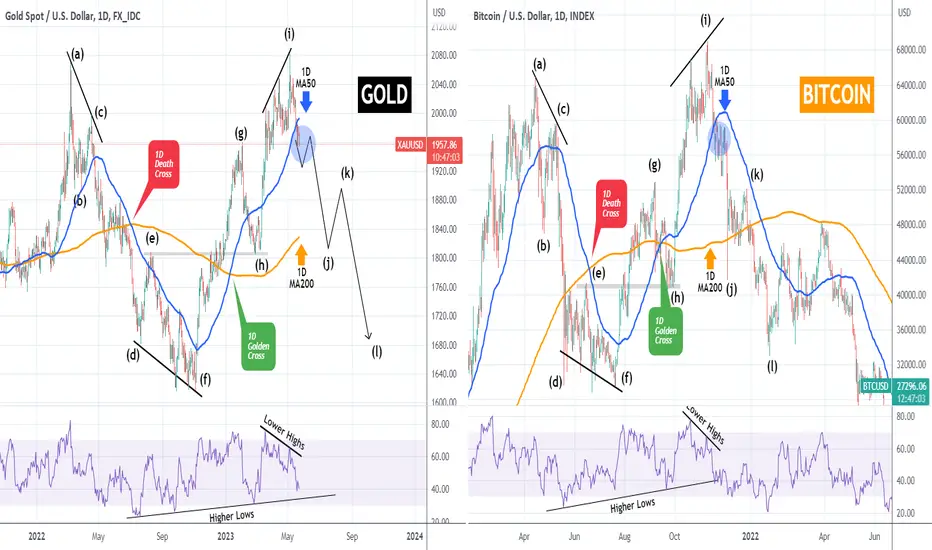
Gold (XAUUSD) is trading below its 1D MA50 (blue trend-line) for the second week in a row, something that hasn't done since early March. In striking fashion Gold's price action since the March 2022 High is astonishingly similar to Bitcoin's (BTCUSD) price action from its April 2021 High to November 2021 (up until now, it remains to be seen if it continues to replicate the pattern).
Bitcoin started falling under Lower Highs, bottomed following a Death Cross and while the 1D RSI was on Higher Lows and a Golden Cross was the mid rally signal to buy for the new market High. It peaked on Higher Highs while the 1D RSI was on Lower Highs (Bearish Divergence) and after breaking below the 1D MA50 again, it never tested it again until leg (l), long after it broke below the 1D MA200 (orange trend-line) as well.
Gold currently declined after the same 1D RSI Lower Highs Bearish Divergence and if it fails to re-establish successive trading days above the 1D MA50 again, it can hit the 1D MA200 (currently at 1828.35 and rising) on leg (j).
Do you think it will pull out that Bitcoin-like correction?
-------------------------------------------------------------------------------
** Please LIKE 👍, FOLLOW ✅, SHARE 🙌 and COMMENT ✍ if you enjoy this idea! Also share your ideas and charts in the comments section below! **
-------------------------------------------------------------------------------
💸💸💸💸💸💸
👇 👇 👇 👇 👇 👇
👑Best Signals (Forex/Crypto+70% accuracy) & Account Management (+20% profit/month on 10k accounts)
💰Free Channel t.me/tradingshotglobal
🤵Contact info@tradingshot.com t.me/tradingshot
🔥New service: next X100 crypto GEMS!
💰Free Channel t.me/tradingshotglobal
🤵Contact info@tradingshot.com t.me/tradingshot
🔥New service: next X100 crypto GEMS!
免責聲明
這些資訊和出版物並不意味著也不構成TradingView提供或認可的金融、投資、交易或其他類型的意見或建議。請在使用條款閱讀更多資訊。