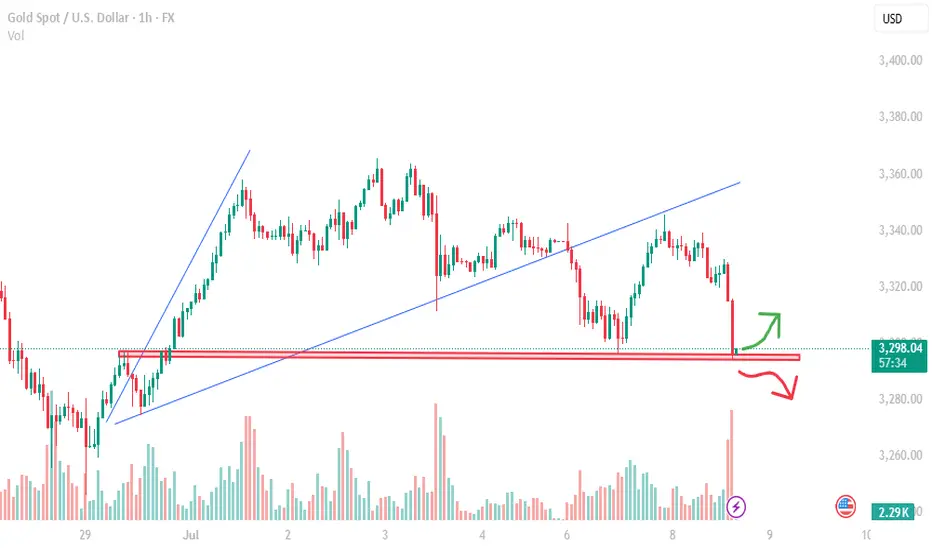
Gold (XAU/USD) is currently trading around $3,296, testing a major support zone after breaking down from a rising wedge pattern. The market is at a pivotal point, and the next move could define the short-term trend for Gold.
🔍 Technical Overview (1H Chart)
• The chart reveals a classic rising wedge pattern, a bearish reversal setup, which has now broken to the downside.
• Price is now hovering at the critical horizontal support zone near $3,295, which has acted as a key level several times in the past.
• A significant volume spike has accompanied the latest move down, highlighting strong selling pressure.
🟢 Bullish Case
If Gold holds above the $3,295 support zone, we could see a bounce and bullish continuation, targeting:
• Target 1: $3,315 (recent high)
• Target 2: $3,330 (next resistance zone)
Confirmation for this setup would require:
• A bullish reversal candle
• Increase in buying volume
• Break above minor intraday resistance levels
🔴 Bearish Case
If price breaks and closes below $3,294 with strong volume:
• Expect a sharp move lower toward $3,280 and potentially $3,260.
• The breakdown would validate the rising wedge pattern and confirm bearish momentum.
📊 Volume Insight
The recent red candle is accompanied by high volume, signaling strong participation by sellers. This increases the risk of a downside continuation unless immediate buying steps in.
🧠 Trading Plan Suggestion
📈 Long Setup
• Entry: Above $3,300 (after bullish confirmation)
• Stop-Loss: Below $3,294
• Take-Profit: $3,315 / $3,330
📉 Short Setup
• Entry: Below $3,294 (after breakdown candle)
• Stop-Loss: Above $3,300
• Take-Profit: $3,280 / $3,260
🔗 Final Thoughts
Gold is at a decision point. A bounce could attract bulls for a short-term rally, while a breakdown might trigger accelerated selling. Let the price confirm the move before entering, and manage risk wisely.
📅 Watch the next 1–2 candles closely — they will reveal the next direction.
Join Sarah Trades -
Free Telegram Signals : t.me/SarahAnalyticsSignals
For Gold signals: t.me/SarahAnalyticsSignals
Free Telegram Signals : t.me/SarahAnalyticsSignals
For Gold signals: t.me/SarahAnalyticsSignals
相關出版品
免責聲明
這些資訊和出版物並不意味著也不構成TradingView提供或認可的金融、投資、交易或其他類型的意見或建議。請在使用條款閱讀更多資訊。
Join Sarah Trades -
Free Telegram Signals : t.me/SarahAnalyticsSignals
For Gold signals: t.me/SarahAnalyticsSignals
Free Telegram Signals : t.me/SarahAnalyticsSignals
For Gold signals: t.me/SarahAnalyticsSignals
相關出版品
免責聲明
這些資訊和出版物並不意味著也不構成TradingView提供或認可的金融、投資、交易或其他類型的意見或建議。請在使用條款閱讀更多資訊。