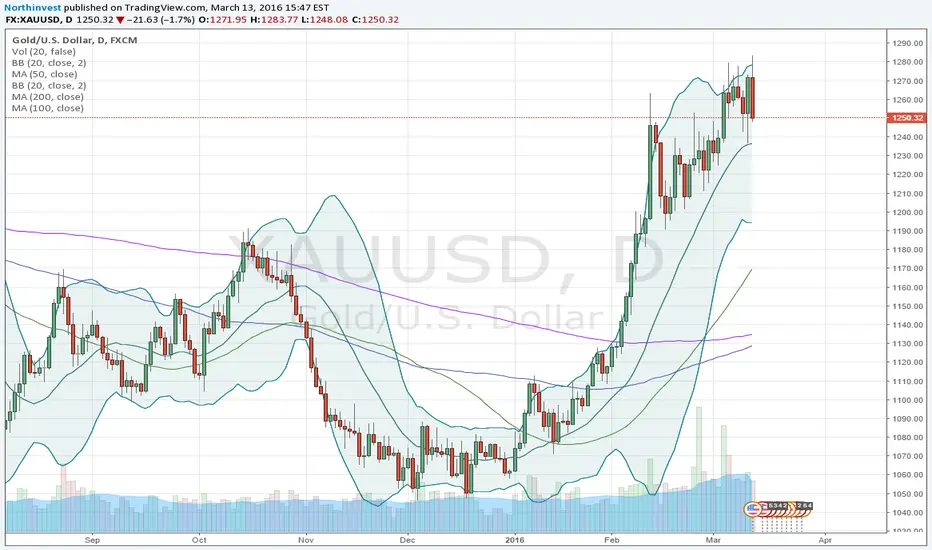
We got ECB set, and USD moving steady as planned. Oil is setteling as well. All this gives gold price a reason do decline. Daily chart shows a big Engulfing candlestick, which is a quite negative sign, -with shadow outside the upper Bollinger band as well. I would wait to see how the price behaves closer to the middle band, before going long which is the main uptrend here. Gold got quite some catch up after all the USD rent anticipation in 2015.
免責聲明
這些資訊和出版物並不意味著也不構成TradingView提供或認可的金融、投資、交易或其他類型的意見或建議。請在使用條款閱讀更多資訊。
免責聲明
這些資訊和出版物並不意味著也不構成TradingView提供或認可的金融、投資、交易或其他類型的意見或建議。請在使用條款閱讀更多資訊。