**📈 Gold (XAU/USD) – Head & Shoulders Pattern Analysis**
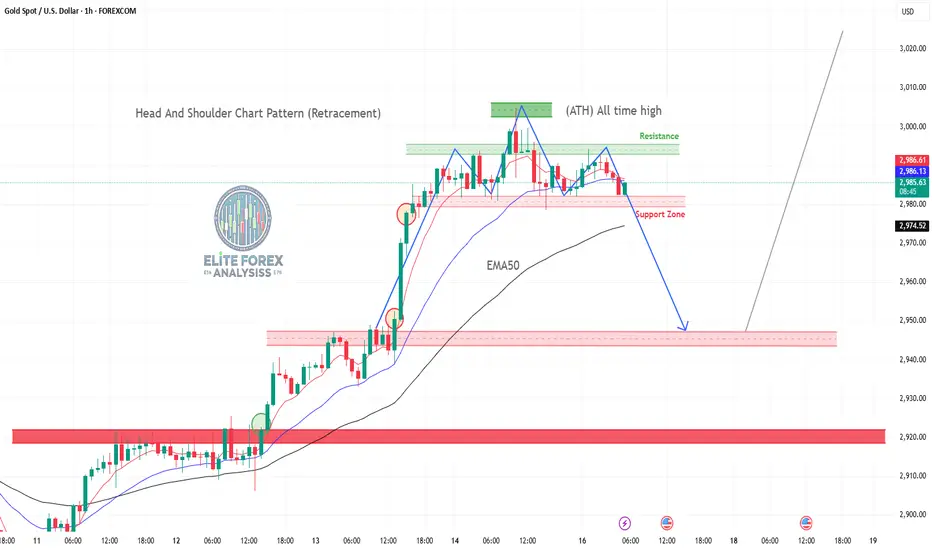
This chart represents the **Gold Spot (XAU/USD) 1-hour timeframe** and shows a potential **Head and Shoulders (H&S) pattern**, which is a bearish reversal signal. Let's break it down:
**🛠 Key Elements of the Chart:**
1. **📉 Head & Shoulders Formation (Bearish Sign)**
- **Left Shoulder**: Price makes a peak, then retraces.
- **Head (ATH – All-Time High at ~$3,005)**: The highest point before pulling back.
- **Right Shoulder**: Another peak, lower than the head, indicating weakness.
- **Neckline (Support Zone)**: Marked in red. A breakdown below this level confirms the pattern.
2. **📊 Exponential Moving Averages (EMA)**
- **EMA50 (Black Line)**: Indicates medium-term trend support.
- Price is testing this moving average, which acts as a dynamic support level.
3. **🔴 Resistance & Support Zones**
- **Resistance (Green Box near ATH)**: Selling pressure is strong at these levels.
- **Support (Red Zones)**: Price could test these areas if the H&S pattern plays out.
4. **📉 Bearish Projection (Blue Arrow)**
- If price **breaks below the neckline (~$2,974)**, it could drop to the next major support at **$2,940–$2,920**.
5. **📈 Bullish Scenario (Gray Arrow)**
- If price **rebounds from EMA50 and the support zone**, it could attempt another rally towards **$3,005 and beyond**.
### **📌 Trading Implications:**
✅ **Bearish Breakdown:**
- Sell below **$2,974** with targets at **$2,950–$2,920**.
- Confirmation comes from increased volume on breakdown.
✅ **Bullish Reversal:**
- If price holds above EMA50 and **breaks $2,990**, it could **retest ATH at $3,005+**.
- Strong buying interest could push gold to **$3,020–$3,050** in a risk-off environment.
### **🔎 Conclusion:**
📊 **Gold is at a critical level**—watch for a **breakout or breakdown** confirmation. A confirmed **H&S breakdown** could signal a retracement, while a **bounce above EMA50** keeps the **bullish trend intact**. 🚀💰 #XAUUSD https://www.tradingview.com/x/76Ekr05D/
免責聲明
這些資訊和出版物並不意味著也不構成TradingView提供或認可的金融、投資、交易或其他類型的意見或建議。請在使用條款閱讀更多資訊。
免責聲明
這些資訊和出版物並不意味著也不構成TradingView提供或認可的金融、投資、交易或其他類型的意見或建議。請在使用條款閱讀更多資訊。