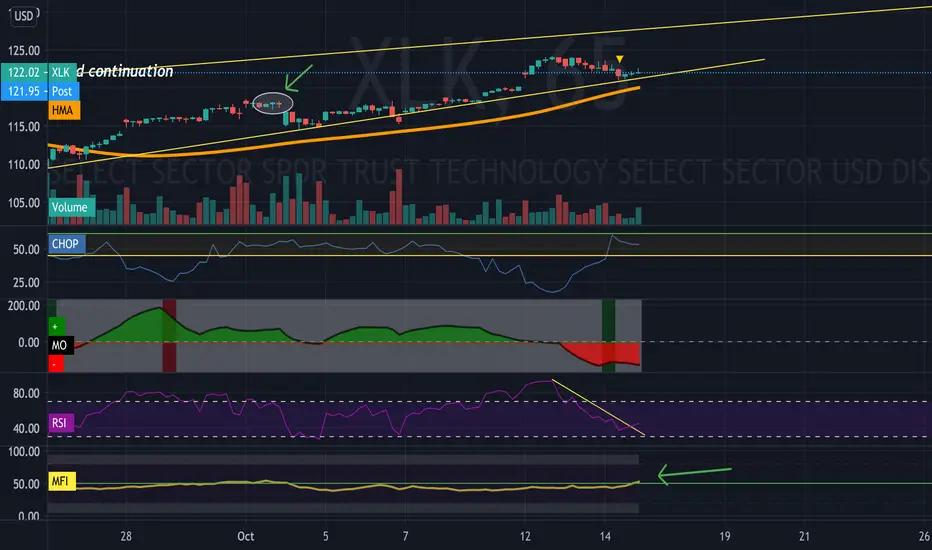
Not that I am bullish on XLK but indeed I am quite bearish at this point. However the 65 minute chart does show a RSI trend break and MFI showing breaking up the 0 line which mean trend bullish, even though these two signals need confirmation.
Cautious with positioning with these signals is what I want to convey.
Disclaimer, this is only for entertainment and education purposes and doesn't serve by any means as a buy or sell recommendation.
Personally I hold both long term long positions and occasionally short term short position, for disclosure purpose.
免責聲明
這些資訊和出版物並不意味著也不構成TradingView提供或認可的金融、投資、交易或其他類型的意見或建議。請在使用條款閱讀更多資訊。
免責聲明
這些資訊和出版物並不意味著也不構成TradingView提供或認可的金融、投資、交易或其他類型的意見或建議。請在使用條款閱讀更多資訊。