
To find the bottom for xmr its best to switch back to higher timeframes. 3day has been working best for me but weekly is also fine.
As correction of the impulse wave there is a possible parallel channel down (from 3day chart).
1.618 Level was the first support which was broken and ended in another sell-off.
Current support was found at the old all time high bottom here is not confirmed.
On channel breakout out up expect major resistance at 0.0156
Horizontal support is likely to be found at the fib levels from old all time high to all time low. Most important horizontal levels are 0.01 and 0.00438. Also watching the green trendlines from old trends.
Being patient with new long entry til bottom is confirmed or heavy oversold on high timeframes.
註釋
I dont trust this little pump yet I dont see a great risk reward for longs here but watching closely註釋
xmr looks really interesting again, watching closely註釋
Those who longed the breakout made a really good trade. Unfortunately i missed that trade.I am not really sure how this plays out, but it looks like there could be a little correction over the next days which could allow another long entry.
交易進行
consolidation above 0.01 is bullish, enter long註釋
out while btc pumping交易進行
see 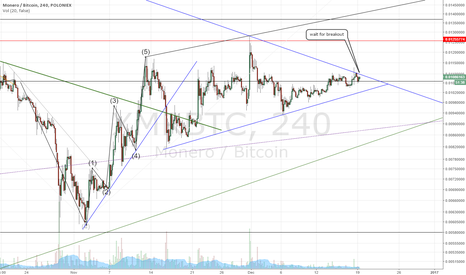
註釋
after taking profit in the 0.014-15 its now time to look back on the weekly chart because this seems to break down and target lower support near 0.004. this is invalidated on breakout of the teal trendline. good to be on sideline here again.
註釋
too lazy to make a new idea yet, also the fib levels from the alltime chart are still working :) took back a small position in xmr.keeping an eye on the ma50 on the daily chart
免責聲明
這些資訊和出版物並不意味著也不構成TradingView提供或認可的金融、投資、交易或其他類型的意見或建議。請在使用條款閱讀更多資訊。