Hey! I am back with Another Technical Analysis with updates!
The More likes, the More updates!
So why I am looking at XRP/BTC chart and not XRP/USDT?
Because the BTC chart shows actual Ripple moves, demand and way precise candles. In USD value you may see that Ripple is losing Value, when in real its just rising in value, that why we look at XRP/BTC in short.
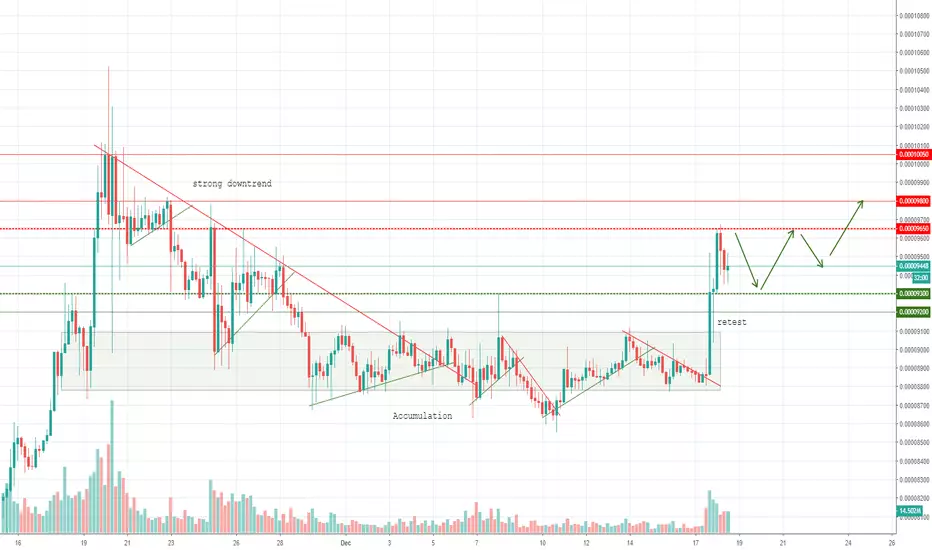
So as I suggested in my previous technical analysis Ripple has been in Accumulation phase with tiny volume, expecting a sharp candle to show up, with a MACD buy signal which was about to be given on a long period timeframe.
And that exactly happened, after the last downtrend was broken in the accumulation phase, Ripple went straight up to test 9500, found some ressistance and was looking for some support with a sharp retest of 9060 by which has XRP vindicated his strength.
So the expected Volume has finally come and time for me to do a Technical Analysis with updates too as there is finally some Volume.
Current Situation.
Ripple has broken through 9300 level and find some stronger ressitance at 9650 as good known ressistance level from the past.
As for now I expect some sharp tests of these two levels (9300 and 9650), breaking ressistance would mean a test of 9800, breaking support would most likely see a test of 9200.
I will post more about next moves and Indicators in Updates, stay tuned!
Thats all from me, for now. If you agree with this Technical Analysis , consider leaving that "Agree Button" blue, as it leads me to post more similiar Technical Analysis .
Thanks for your time and good luck trading!
The More likes, the More updates!
So why I am looking at XRP/BTC chart and not XRP/USDT?
Because the BTC chart shows actual Ripple moves, demand and way precise candles. In USD value you may see that Ripple is losing Value, when in real its just rising in value, that why we look at XRP/BTC in short.
So as I suggested in my previous technical analysis
And that exactly happened, after the last downtrend was broken in the accumulation phase, Ripple went straight up to test 9500, found some ressistance and was looking for some support with a sharp retest of 9060 by which has XRP vindicated his strength.
So the expected Volume has finally come and time for me to do a Technical Analysis with updates too as there is finally some Volume.
Current Situation.
Ripple has broken through 9300 level and find some stronger ressitance at 9650 as good known ressistance level from the past.
As for now I expect some sharp tests of these two levels (9300 and 9650), breaking ressistance would mean a test of 9800, breaking support would most likely see a test of 9200.
I will post more about next moves and Indicators in Updates, stay tuned!
Thats all from me, for now. If you agree with this Technical Analysis , consider leaving that "Agree Button" blue, as it leads me to post more similiar Technical Analysis .
Thanks for your time and good luck trading!
註釋
註釋
This chart show more clearly that downtrend which tested succesfuly support was broken and uptrend has been formed which is headed to test 9600 levels, as long as uptrend remains.
註釋
On the chart you can see two strong zones where Ripple likes to accumulate. By a simple use of two emas, you can easily tell that trend has changed from bear trend to bull trend. MACD is showing two very healthy macd cycles, today might be the first day in buy signal, if XRP closes above daily candle above 9400.
RSI shows good overal demand.
註釋
註釋
註釋
註釋
註釋
註釋
Looks like there is still some downtrend, but as I stated above, its good sign that XRP maintans to act this stable after such moves. Demand looks still great, lets look at what 5 min has to say.
註釋
註釋
註釋
免責聲明
這些資訊和出版物並不意味著也不構成TradingView提供或認可的金融、投資、交易或其他類型的意見或建議。請在使用條款閱讀更多資訊。