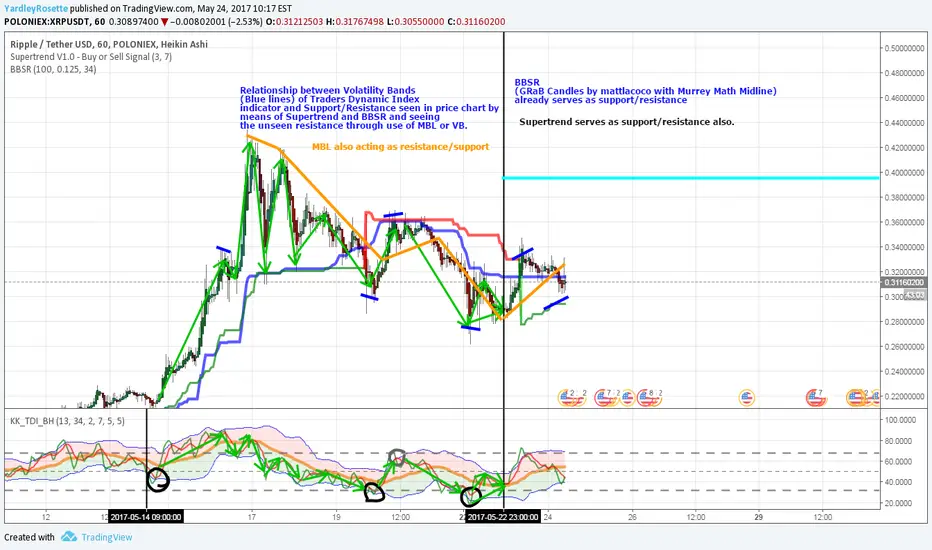
Chart presented shows behavior of lines related to price chart for better use (& understanding) of Traders Dynamic Index for whoever really cares about profiting.
Volatility Bands relate to the price chart showing price resistance or support at the moment.
Market BaseLine may show itself to be support or resistance.
Supertrend & BBSR serve as price chart indication of support or resistance.
RSI/TSI (Green/Red) cross at 32 or 50 while or after, or near crossing into VB lines serves as a powerful/advantageous entry depending also on a bit more of price chart analysis.
註釋
This is/was not a trade analysis.免責聲明
這些資訊和出版物並不意味著也不構成TradingView提供或認可的金融、投資、交易或其他類型的意見或建議。請在使用條款閱讀更多資訊。
免責聲明
這些資訊和出版物並不意味著也不構成TradingView提供或認可的金融、投資、交易或其他類型的意見或建議。請在使用條款閱讀更多資訊。