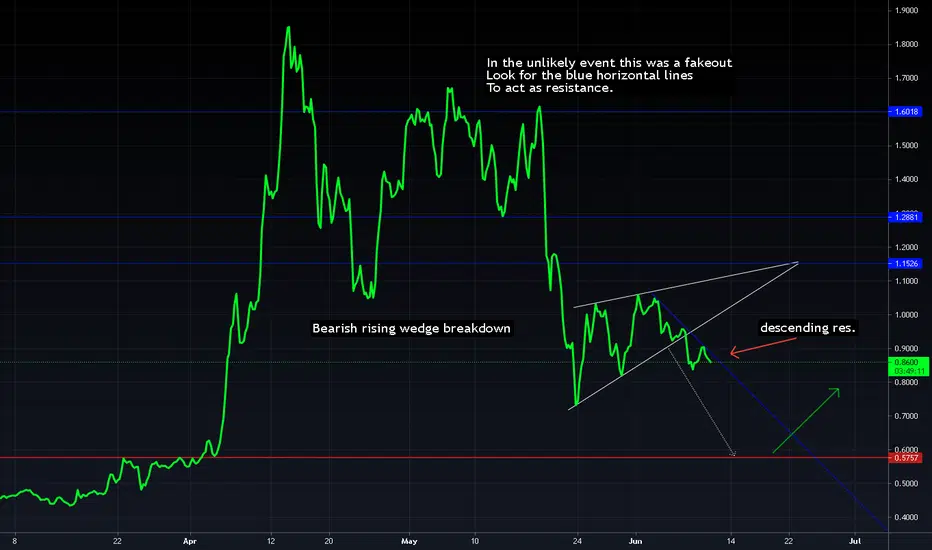
Fairly basic look at XRP on line-chart 6hr using the (O+H+L+C)/4 setting to display PA
I'd be expecting a test of the lower breakout region in the upper .5's before XRP makes a bullish recovery to continue it's macro uptrend.
In the event XRP spontaneously recovers, I've included some resistance levels for tp points
I had my eyes on this chart for quite some time & have finally decided that it's likely to play out in the bears favor:

註釋
Gold vs XRP is extremely bearish atm & looking like XRP is set to make a major move up against gold:Silver vs XRP very bearish for silver, looking like XRP is ready to make some major gains against it!!
註釋
tradingview.com/x/ADvWIXex.pnglook familiar?
註釋
Here was an earlier chart demonstrating a similar Idea
免責聲明
這些資訊和出版物並不意味著也不構成TradingView提供或認可的金融、投資、交易或其他類型的意見或建議。請在使用條款閱讀更多資訊。