Plenty of traders buy XTZ whenever LINK makes a big move in the hope that the same will hapen with Tezos. There has been a lot of discussion if this practice is a waste of time or has an acctual edge. I will share here an idea that is being developed for the past 3 months. The sample size is still low at 20 trades, 30 would be optimal, so this is in progress.
WILL POST ALL POSITIONS BELOW
The strategy:
Toyed with plenty of indicators, support and resistances that affect LINK. However using them on a different asset produced quite some noise because of the lag that was acctualy needed in this correlation strategy. So in the end the winners were simple increases/decreases in the price and volume at which LINK was trading. Used many different increases/decreases tresholds to time positions. Small price increases like "up by 2% in the last day" were not productive.
Secondly the need for a confirmation indicator to close positions became apparent as we were holding winning positions too shortly. A simple SMA, albait at length 60 SMA did the trick.
The rules:
Painfully simple rules is the way to go. This is all done on the 1H timeframe, although we look at the previous day price/volume movements too. So in our case we will:
Open an XTZ position when: LINK/USDT price is up by 5% in last day
Close the XTZ position when: LINK Total Volume is down by 4% in last day AND Price is below SMA (60)
No Stop Loss or Take Profit
Do not open a psoition if both the open and close rule are true at the same time (price is up, but volume is tanking)
The results:
In the last 3 months the strategy brought in +66% on spot. If you were just holding XTZ you'd have +39.5%, so a significant imrovement with a lot of potential on futures.
We saw 20 trades in the 3 months, loosing 11 and winning 9. The wins are more sizable with the gains, so maintaining this rate would be ideal. Most positions are held for 2-3 days.
The max drawdown in the entire period was 7.75% which is excellent.
The optimization:
It might be worth looking for a third close indicator as it still does not capture the peaks to perfection. In case anyone has an idea, please post it.
The positions:
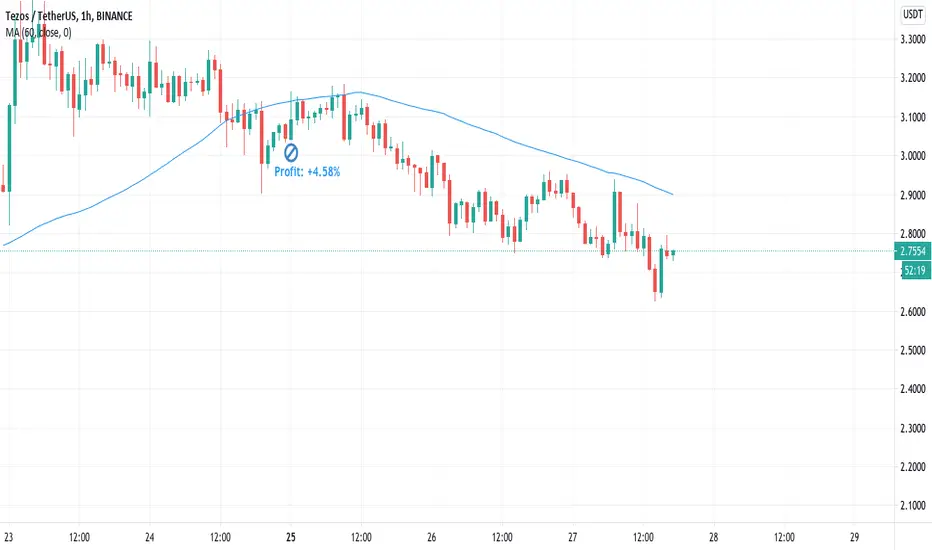
21/01/2021 00:00
25/01/2021 00:00
4 days
OP 2.9099
CP 3.0431
+4.58%
18/01/2021 06:00
19/01/2021 19:00
2 days
OP 2.9157
CP 2.9351
+0.665%
17/01/2021 19:00
18/01/2021 05:00
10 hours
OP 2.8984
CP 2.8806
-0.614%
13/01/2021 14:00
17/01/2021 08:00
4 days
OP 2.4038
CP 2.7634
+15%
12/01/2021 07:00
13/01/2021 00:00
17 hours
OP 2.3687
CP 2.2979
-2.99%
09/01/2021 16:00
10/01/2021 19:00
1 day
OP 2.6017
CP 2.547
-2.1%
09/01/2021 04:00
09/01/2021 05:00
1 hour
OP 2.5415
CP 2.5249
-0.653%
03/01/2021 01:00
08/01/2021 01:00
5 days
OP 1.9975
CP 2.4438
+22.3%
01/01/2021 13:00
02/01/2021 00:00
OP 2.0743
CP 2.0081
-3.19%
24/12/2020 23:00
31/12/2020 00:00
6 days
OP 2.0752
CP 1.9896
-4.12%
16/12/2020 17:00
19/12/2020 00:00
2 days
OP 2.3128
CP 2.3253
+0.54%
12/12/2020 12:00
16/12/2020 01:00
4 days
OP 2.1392
CP 2.2155
+3.57%
09/12/2020 23:00
11/12/2020 00:00
1 day
OP 2.1786
CP 2.1059
-3.34%
03/12/2020 04:00
03/12/2020 06:00
2 hours
OP 2.4209
CP 2.38
-1.69%
27/11/2020 17:00
03/12/2020 00:00
5 days
OP 2.2312
CP 2.3885
+7.05%
20/11/2020 09:00
26/11/2020 00:00
6 days
OP 2.1004
CP 2.5969
+23.6%
16/11/2020 18:00
20/11/2020 00:00
3 days
OP 2.0879
CP 2.0773
-0.508%
10/11/2020 10:00
12/11/2020 00:00
2 days
OP 2.1627
CP 2.1244
-1.77%
05/11/2020 15:00
09/11/2020 03:00
4 days
OP 1.9195
CP 2.0808
+8.4%
27/10/2020 17:00
29/10/2020 00:00
1 day
OP 2.1036
CP 2.0003
-4.91%
Happy to answer any questions!
WILL POST ALL POSITIONS BELOW
The strategy:
Toyed with plenty of indicators, support and resistances that affect LINK. However using them on a different asset produced quite some noise because of the lag that was acctualy needed in this correlation strategy. So in the end the winners were simple increases/decreases in the price and volume at which LINK was trading. Used many different increases/decreases tresholds to time positions. Small price increases like "up by 2% in the last day" were not productive.
Secondly the need for a confirmation indicator to close positions became apparent as we were holding winning positions too shortly. A simple SMA, albait at length 60 SMA did the trick.
The rules:
Painfully simple rules is the way to go. This is all done on the 1H timeframe, although we look at the previous day price/volume movements too. So in our case we will:
Open an XTZ position when: LINK/USDT price is up by 5% in last day
Close the XTZ position when: LINK Total Volume is down by 4% in last day AND Price is below SMA (60)
No Stop Loss or Take Profit
Do not open a psoition if both the open and close rule are true at the same time (price is up, but volume is tanking)
The results:
In the last 3 months the strategy brought in +66% on spot. If you were just holding XTZ you'd have +39.5%, so a significant imrovement with a lot of potential on futures.
We saw 20 trades in the 3 months, loosing 11 and winning 9. The wins are more sizable with the gains, so maintaining this rate would be ideal. Most positions are held for 2-3 days.
The max drawdown in the entire period was 7.75% which is excellent.
The optimization:
It might be worth looking for a third close indicator as it still does not capture the peaks to perfection. In case anyone has an idea, please post it.
The positions:
21/01/2021 00:00
25/01/2021 00:00
4 days
OP 2.9099
CP 3.0431
+4.58%
18/01/2021 06:00
19/01/2021 19:00
2 days
OP 2.9157
CP 2.9351
+0.665%
17/01/2021 19:00
18/01/2021 05:00
10 hours
OP 2.8984
CP 2.8806
-0.614%
13/01/2021 14:00
17/01/2021 08:00
4 days
OP 2.4038
CP 2.7634
+15%
12/01/2021 07:00
13/01/2021 00:00
17 hours
OP 2.3687
CP 2.2979
-2.99%
09/01/2021 16:00
10/01/2021 19:00
1 day
OP 2.6017
CP 2.547
-2.1%
09/01/2021 04:00
09/01/2021 05:00
1 hour
OP 2.5415
CP 2.5249
-0.653%
03/01/2021 01:00
08/01/2021 01:00
5 days
OP 1.9975
CP 2.4438
+22.3%
01/01/2021 13:00
02/01/2021 00:00
OP 2.0743
CP 2.0081
-3.19%
24/12/2020 23:00
31/12/2020 00:00
6 days
OP 2.0752
CP 1.9896
-4.12%
16/12/2020 17:00
19/12/2020 00:00
2 days
OP 2.3128
CP 2.3253
+0.54%
12/12/2020 12:00
16/12/2020 01:00
4 days
OP 2.1392
CP 2.2155
+3.57%
09/12/2020 23:00
11/12/2020 00:00
1 day
OP 2.1786
CP 2.1059
-3.34%
03/12/2020 04:00
03/12/2020 06:00
2 hours
OP 2.4209
CP 2.38
-1.69%
27/11/2020 17:00
03/12/2020 00:00
5 days
OP 2.2312
CP 2.3885
+7.05%
20/11/2020 09:00
26/11/2020 00:00
6 days
OP 2.1004
CP 2.5969
+23.6%
16/11/2020 18:00
20/11/2020 00:00
3 days
OP 2.0879
CP 2.0773
-0.508%
10/11/2020 10:00
12/11/2020 00:00
2 days
OP 2.1627
CP 2.1244
-1.77%
05/11/2020 15:00
09/11/2020 03:00
4 days
OP 1.9195
CP 2.0808
+8.4%
27/10/2020 17:00
29/10/2020 00:00
1 day
OP 2.1036
CP 2.0003
-4.91%
Happy to answer any questions!
Innovative all-in-one trading and backtesting platform
cleo.finance
Test trading strategies on crypto, stocks, indices, forex with decades of 1-min data.
cleo.finance
Test trading strategies on crypto, stocks, indices, forex with decades of 1-min data.
免責聲明
這些資訊和出版物並不意味著也不構成TradingView提供或認可的金融、投資、交易或其他類型的意見或建議。請在使用條款閱讀更多資訊。