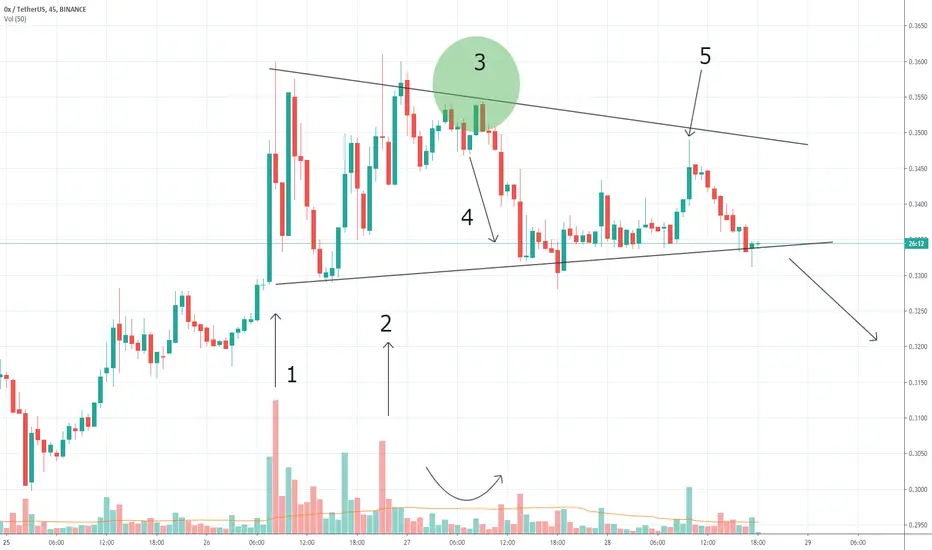
Zrx looks very weak on this 45m chart.
You see 1-2 bars with the maximum volume, I highlighted them with two arrows, they have a maximum above the level of 0.35. However, these extremely high volumes on attempts to rise can mean hidden weakness.
Most likely, hidden professional selling occurred around 0.35 because at point 3 there is trading on very small volumes near the resistance level. This means a weak market and a lack of demand.
Arrow number 4 indicates a surge in volumes amid falling prices - a typical occurrence for selling pressure. Sellers come out of the shadows.
A burst of activity on arrow number 5 indicates a bull trap. This is a fraudulent movement that often occurs on the eve of decline.
Thus, we can most likely say that the chart tells us a bearish story. Several attempts to establish a bullish trend were not successful, therefore, a bearish breakdown of the triangle in this situation looks like the most logical development.
Check my taplink.cc/chartreadingpro
免責聲明
這些資訊和出版物並不意味著也不構成TradingView提供或認可的金融、投資、交易或其他類型的意見或建議。請在使用條款閱讀更多資訊。
Check my taplink.cc/chartreadingpro
免責聲明
這些資訊和出版物並不意味著也不構成TradingView提供或認可的金融、投資、交易或其他類型的意見或建議。請在使用條款閱讀更多資訊。