XAU/USD – 黃金保持上升趨勢,等待重測 4,211 以反彈至 4,236 → 4,254在亞洲交易時段後,黃金繼續保持短期上升結構,因價格不斷創造更高的低點(HL)並維持在上升趨勢線之上交易。由於市場預期美聯儲將採取溫和立場,美元走弱也正在支持資金回流至貴金屬。
目前市場正進入阻力下的“壓縮”區域,這表明在新一輪擴展之前的積累跡象。
📊 技術展望 – MMF 流量(H1)
1️⃣ 主要支撐
4,211 – 4,212 → 重要重測區域 + 趨勢線匯合 + 之前的 HL 底部。
4,187 – 4,188 → 更深的支撐,之前的強勁買入區域。
當價格保持在 4,211 之上 → 短期趨勢繼續看漲。
2️⃣ 主要阻力 / 流動性區域
4,236 → 近期供應區,流動性聚集。
4,254 – 4,255 → 擴展目標,上方的大流動性區域。
價格正在趨勢線下降處反應,但上升動力仍保持主動。
🧭 MMF 交易情景
▶️ 主要情景 – 按趨勢買入
等待價格重測:
🔹 買入區域:4,211 – 4,213
🔹 止損:低於 4,206
🔹 第一目標:4,236
🔹 第二目標:4,254
邏輯:價格在日內打破下降結構,創造更高的 HL 並逐漸接近下降趨勢線 → 突破的可能性非常高。
▶️ 次要情景 – 更深的買入
如果市場“沖刷”以獲取流動性:
🔹 在 4,187 – 4,189 買入
目標與主要情景相同。
🎯 每日偏向總結
偏向:當價格保持在 4,211 之上時看漲。
優先:在重測時買入 → 僅短期內賣出。
目標:4,236 → 4,254 是市場很容易被拉升掃過的流動性區域。
斐波那契

SMC 交易計劃 – XAUUSD (1H)1. 市場背景
觀察圖表顯示:
價格正在短期下降趨勢中移動,通過多次被掃過但尚未果斷突破的下降趨勢線顯示出來。
價格兩次觸及趨勢線都產生了強烈反應 → 確認這是一個動態阻力區。
市場已經在高點和低點創建了 MSS(市場結構轉變)→ 顯示出過渡階段,適合在反應區進行剝頭皮交易。
您標記的價格水平(4,230 – 4,219 – 4,192 – 4,181)確實是潛在的流動性池/訂單區塊。
2. 主要趨勢與智能資金意圖
✔ 智能資金正在做什麼?
吸引4,158 – 4,160區域下方的流動性(在圖表中標註為“流動性”)。
推動價格上升以重新測試趨勢線附近的阻力,以獵取多頭的流動性。
然後將價格推向更深的折扣區域 → 然後再決定是突破還是繼續分配。
也就是說:短期買入 – 短期賣出 – 然後在流動性底部更強勁地買入
→ 這是SMC中的標準流動性獵取 – MSS – 反轉模型。
3. 兩個主要情景
情景1 – 從阻力賣出(優先)
價格正在接近您標記的趨勢線和阻力區。這是一個高概率的設置。
理想的賣出區域:
📍 4,219 – 4,221(反應區 + FVG + 趨勢線重新測試)
剝頭皮目標:
TP1 → 4,192
TP2 → 4,181
如果強力突破:擴展至4,160 – 4,158(主要流動性區域)
止損:4,230.7(在流動性掃過區域上方)
賣出理由
觸及下降趨勢線 → 強烈的技術反應。
這是上升波段的溢價區域。
在推低以獵取流動性之前,容易形成短期分配。
情景2 – 從流動性區域買入(次優先)
如果價格先下跌以獲取流動性,我們優先在底部區域買入。
強勁的買入區域(流動性區域):
📍 4,160 – 4,158
→ 這是智能資金標記的底部,以獵取止損並創造新低。
目標:
TP1 → 4,181
TP2 → 4,192
TP3 → 4,219 – 4,230(預期推高以獲取頂部流動性)
止損:4,146
買入理由
明顯的流動性區域,由之前的低點創建。
與下方趨勢線重合。
前兩個MSS顯示市場正在積累以進行短期反轉。
4. 詳細交易計劃
🎯 賣出設置 – 快速剝頭皮(優先)
進場:4,219 – 4,221
止損:4,230
目標:
TP1: 4,192
TP2: 4,181
TP3: 4,160(如果價格下跌)
高概率因為:趨勢線反應 + 溢價區域 + 流動性積累。
🎯 買入設置 – 安全(等待價格下跌)
進場:4,160 – 4,158
止損:4,146
目標:
TP1: 4,181
TP2: 4,192
TP3: 4,219 – 4,230
高概率因為:主要流動性區域 + 折扣區域 + 智能資金可能從底部推高。
5. 交易建議
只有在有明確反應時才下單:影線拒絕,小幅結構下降/結構突破在M5上。
不應在區域中間下單 – 只有當價格正確觸及關鍵水平時才交易。
剝頭皮應優先快速TP,因為黃金的波動幅度相當大。
📌 結論
您的圖表根據SMC給出了非常明確的信號:
在溢價區賣出 – 在折扣區買入 – 所有圍繞流動性獵取和MSS。
兩個交易區域已經非常明確地確定:
✔ 賣出區域:4,219 – 4,221
✔ 買入區域:4,160 – 4,158

1204 BTC多頭持續發力 繼續上攻 日內交易計畫市場現況
BTC 目前延續強勢反彈,短線結構已成功站上 92,200 一帶
形成 前高反壓翻支撐 的多頭節奏
關鍵區域解析
92SNR 區(短線支撐) — $92,200→ 前高反壓翻支撐,多頭回踩優先守護位置
BBD+ 區(反彈壓力帶 / 高空佈局) — $94,300–$97,000 → 大量供應堆疊,多方獲利了結區
98SNR 區(中期強壓) — $98,300 → 若成功突破 BBD+,此區為下一個中期反壓條件
W 區(週開盤 / 多空分界) — $90,350 → 為整個週期的多空分水嶺
交易計畫
路徑 A(主策略)|回踩 92SNR / W → 做多
條件:價格回落至 $92,200(92SNR) 或深一點回踩到 $90,350(W 區)
出現長下影、止跌吞沒、結構翻轉等右側信號
進場:92,200–92,500 區間右側多或 W 區 $90,350 止跌後接多
目標:第一目標:$94,300(BBD+ 下緣)第二目標:$96,000–$97,000(BBD+ 上緣)
止損:91,700 下方(破位表示短線多頭失守)
路徑 B(次策略)|強攻進入 BBD+ → 等反應再埋伏多空
條件:放量直接突破 $97,000 回踩不破 96,500 再度上攻
目標:$98,300(98SNR)強勢可看 $100,000 心理關卡
止損: 96,200 下方
總結觀察
1.主策略仍是回踩多,尤其 92,200 / 90,350 是支撐核心
2.BBD+ 是大壓力,容易產生多空搶籌,需特別留意反應
3.若強勢突破 BBD+,短線將快速挑戰 98,300
4.若跌破 W 區,短線結構將轉弱,須重新評估多單
以上為個人觀點分享,不構成投資建議,請朋友們謹慎評估

XAU/USD – 黃金保持上升結構,優先考慮在支撐位回測時買入黃金繼續在壓縮模型和上升支撐中波動,顯示出賣壓正在減弱,市場希望在上升到上方供應區域之前進行積累。
最近的數據顯示,由於市場預期美聯儲將更加溫和,美元降溫→為XAU/USD的短期上升提供支撐。
📊 技術分析 – H1框架(MMF流)
1️⃣ 重要支撐:
4,187 – 4,188:買入區域+下方趨勢線+強烈價格反應。
價格剛剛回測並反彈→確認主動買入仍然存在。
2️⃣ 近期阻力:
4,211 – 4,212:中間流動性區域→預期在突破下降趨勢線前創造HL。
3️⃣ 主要目標區域:
4,236 → 強阻力,多次市場匯合。
更遠:4,254 → 大供應區域,若價格突破則為擴展目標。
🧭 MMF交易情境
主要情境 – 順勢買入
當價格回測4,187 – 4,188時買入或
當價格突破4,212後回測時買入。
TP目標:
TP1:4,212
TP2:4,236
TP3:4,254
SL:低於4,182。
想法:價格在趨勢線上創造吸收模型+HL→可能推升至上方流動性區域。
次要情境 – 反應性賣出
僅供短線交易者使用:
在4,236 – 4,238反應性賣出
TP:4,212
SL:4,243
🎯 日偏向總結
偏向:當價格保持在4,187時,H1看漲。
優先:在底部區域買入 – 僅在上方區域短線賣出。
等待突破下降趨勢線以將目標擴展至4,254。

XAU/USD – 等待 4,203 再測試後的下一波上升趨勢(MMF 日內計劃 – 12月03日)
黃金在上週大幅下跌後繼續回升,但目前的上升動能仍然較弱,需要流動性掃描 + 清晰回調後才能進一步推高。
在 M30–H1 結構中,價格仍在下降趨勢線下方移動,這表明黃金可能需要更深入地再測試 4,203 需求區——這是關鍵區域:
✔️ 最新衝動的 Fibo 0.618
✔️ 之前創造強勁上升位移的需求
✔️ 流動性位於最近短期低點下方
✔️ 上升波的高低結構(HL)
一旦這個區域穩固,黃金將準備好下一次向上的擴展。
🧭 主要情境 – MMF 買入設置
買入區域:4,203 – 4,205
止損:低於 4,197
TP1:4,230
TP2:4,242(主要目標 – 供應區 + Fibo 1.272)
如果價格突破 4,242 並伴隨動能 → 下一波上升延伸目標 4,249–4,252。
⚠️ 次要情境(僅限短線賣出)
短期短線,不屬於主要趨勢計劃:
賣出反應區:4,230 – 4,232
止損:4,236
TP:4,215
僅在趨勢等待確認時作為快速反應交易使用。
📌 每日偏好總結
日內偏好保持看漲,只要價格保持在 4,197 以上。
今天的最佳設置:等待清晰回調至 4,203 以進行主要買入。
由於即將發布的數據,預計紐約時段波動性增加 → 謹慎管理倉位。

1203 BTC 多頭強勢反攻 收復10W在即? 日內交易計畫市場現況
BTC 目前維持短線強勢反彈,價格已成功站上 92SNR 附近並形成短週期上升節奏
雖然整體偏多,但上方已逼近 BBD+($94,300–$97,000)供應反壓區
屬於多頭「強但進入壓力帶」的行情
關鍵區域解析(條列式)
92SNR 區(短線支撐) — $92,200 → 前高反壓翻支撐,為多頭回踩優先守護點
D 區(日內中繼支撐) — $91,800–$92,000 → 若出現下影、止跌吞沒,為右側多切入點
BBD+ 區(反彈壓力帶 / 高空佈局) — $94,300–$97,000
→ 供應壓力重,可視為獲利了結+反轉空埋伏區。
98SNR 區(中期強壓) — $98,300 → 若多頭突破 BBD+,此區為下一個重要反壓
W 區(週開盤 / 多空分界) — $90,350 → 多頭結構若要維持,需要穩站 W 之上
交易計畫
路徑 A(主策略)|回踩 92SNR / D 區止跌 → 做多
條件:價格回踩 92,200 or 91,800–92,000(D 區)
出現長下影、止跌吞沒、結構翻轉訊號
進場位置:91,800–92,200 區間右側多
多單目標:第一目標:94,300 第二目標:96,000–97,000(BBD+)第三目標:98,300(98SNR)
止損: 跌破 91,500
路徑 B(次策略)|強攻進入 BBD+ → 等反應再埋伏多空
條件:強勢突破 BBD+ → 多 放量突破 97,000 並站穩
目標: 98,300 / 99,500
止損: 跌回 96,500 下方
總結觀察
1.主策略仍是回踩低多,尤其 92SNR、D 區是關鍵承接
2.BBD+ 是主力反壓帶,多空都可能在這裡決定方向
3.只要 不跌破 W 區 $90,350,多頭結構仍完整
4.上攻 98,300 前,容易出現震盪洗盤
以上為個人觀點分享,不構成投資建議,請朋友們謹慎評估

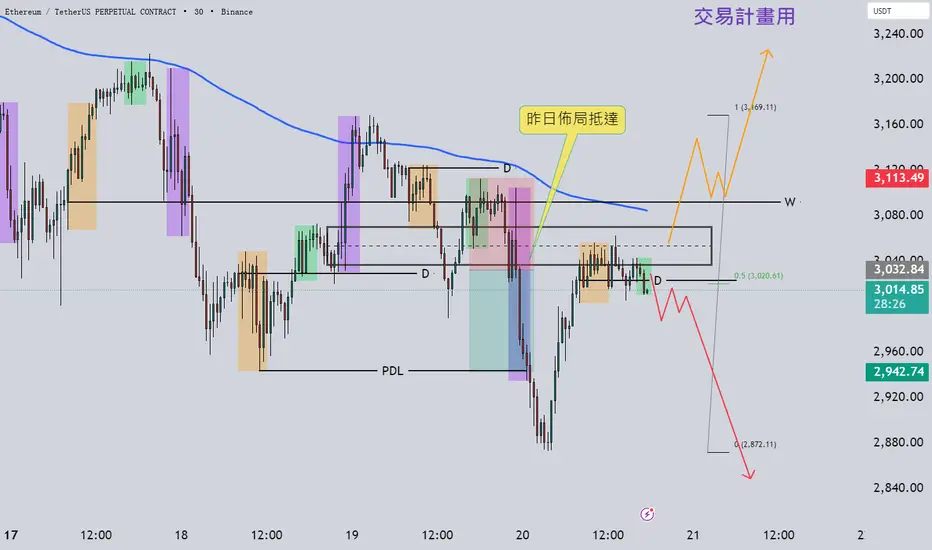
1203 ETH多頭反攻來襲 站穩3000? 12月推新高? 日內交易計畫市場現況
ETH 目前已成功突破 BB 區 $3,000–$3,080,並持續站穩在區間之上
短線動能由盤整轉為 偏強反攻結構
關鍵區域解析
BB 區(突破後的支撐帶) — $3,000–$3,080
W 區(週開盤 / 多空分界) — $2,990
0.5 回撤中軸(短線加速位置) — $3,141
SNR32 區(第一波反彈目標) — $3,250
SNR34 區(中期反攻壓力) — $3,400
交易計畫
路徑 A|突破 BB + 0.5 → 回踩不破 做多(主策略)
條件:價格突破 $3,141 並站穩
回踩 0.5 或 BB 上緣不破,出現下影 / 強勢 K
進場:回踩 $3,080–$3,141 區間的右側多
目標一: $3,250(SNR32)目標二: $3,400(SNR34)
止損: $3,000 下方
路徑 B|回踩 W 區後止跌 → 低多佈局(次策略)
條件:價格回踩 W 區 $2,990 附近
出現吸籌訊號(長下影 / 多頭吞沒 / 結構翻轉)
進場:→ W 附近止跌後進場多
目標:$3,080 → $3,141 → $3,250
止損: $2,960 下方(假突破確認)
總結觀察
1.主節奏偏多,關鍵是能否站穩 3141
2.BB 與 W 區都是多頭的回踩承接點
3.突破 3141 → 看 3250 / 3400
4.若跌破 W 區,將回到震盪偏弱,但目前多方仍佔優勢
以上為個人觀點分享,不構成投資建議,請朋友們謹慎評估。

1202 BTC持續下跌震盪 下個目標7XXXX? 日內交易計畫市場現況
BTC 昨日急跌後出現短線技術性反彈,目前價格在 BB 回抽壓力帶 $86,800–$88,200 內震盪整理
屬 弱勢反彈修正,尚未收回結構反壓,也尚未突破 0.5 回撤中軸 $88,423
關鍵區域解析
92SNR 區(前高結構反壓) — $92,200
W 區(週開盤反壓) — $90,300
BB 區(回抽反彈壓力帶) — $86,800–$88,200
0.5 回撤中軸(反彈修正) — $88,423
0 區(深度掃流動性目標) — $80,645
交易計畫
路徑 A|反彈至 BB + 0.5 → 轉弱做空(主策略)
條件:
反彈至 $86,800–$88,200(BB) 或 $88,423(0.5 中軸)
出現 上影 / 吞沒 / 假突破 / 量能衰退
進場: 反彈空 / 逢高空
目標: $85,800 / $84,500 / $82,700 / $80,645
止損: 收在 $88,900 以上
路徑 B|跌破日開盤 → 反彈無力做空(次策略)
條件: 跌破 日開盤價(依當天數值)並回踩不收回
進場: 回踩失敗空
目標: $85,800 / $84,500 / $82,700 / $80,645
止損: 重新站回日開盤上方
總結觀察
1.主策略仍為反彈空,只要不強勢突破 BB + 0.5
2.跌破日開盤為續空強訊號
3.目標看向 $80,645 深度掃流動性
4.未站回 $88,423 前,不考慮多方敘事
以上為個人觀點分享,不構成投資建議,請朋友們謹慎評估。

XAUUSD – 今日交易計劃您好,交易者們!
您對今天黃金的走勢有什麼看法?
📰 市場背景
今天早上,美聯儲主席發表了演講,但未提及任何經濟更新。然而,黃金仍然出現了修正性走勢,顯示出賣方目前仍然掌控局面。
📌 今日主要策略
🔴 偏好賣出設置
只有當價格突破4,246時才停止賣出——這是一個由賣方防守的關鍵水平。
考慮在之前高點4,265進行賣出進場。
需關注的額外賣出反應區域:4,227 – 4,225。
在更深的回調中買入
理想的買入區域:4,194 – 4,190
較近的買入區域:4,209 – 4,206
→ 僅在價格在支撐附近顯示出強烈反應或反轉模式時買入。
🎯 風險管理
止損 (SL):100 點
止盈 (TP):100 點
→ 在整個交易時段保持風險一致。
您認為黃金會繼續承受看跌壓力並持續下跌,
還是會從這些關鍵支撐區域反彈並重新獲得上升動力?

BTC看空至81K~73K20251202
空军在上一周给予了足够的时间买盘反击,但是不尽人意
这周马上出现了两根空军短期的主导型量能,也意味着趋势大概率继续延续下跌
行情目前回到0.618,可以再这个位置开空,逐步布局空单
带好止损

1201 ETH反攻失敗 持續下探 日內交易計畫市場現況
ETH 昨日大幅下殺後,目前價格位於 $2,840–$2,860 一帶弱勢反彈
結構屬 急跌後反抽修正,尚未形成有效反轉訊號
關鍵區域解析
BB 區(反彈壓力帶) — $2,950–$3,080
W 區(週開盤 / 多空分界) — $2,990
0.5 回撤中軸(短線反彈修正) — $2,860
OB+ 區(底部吸籌 / 流動性集中) — $2,510–$2,590
0 區(深度掃流動性目標) — $2,621
交易計畫
路徑 A|反彈至 BB 區轉弱 → 做空(主策略)
條件: 反彈至 $2,860 / $2,950–$3,080 出現 上影、吞沒、量能衰退、假突破型態
進場: BB 高空 & 反彈空
目標: $2,806 / $2,760 / $2,700 / $2,621
止損: $3,100–$3,120 上方
路徑 B|跌破日低做空(動能空延伸)
條件: 跌破 $2,806(前低 / 日低流動性) 並放量
進場: 回抽不破 $2,806 → 加碼空
目標: $2,700 / $2,621 / $2,590(OB+ 上緣)
止損: $2,860 上方
總結觀察
1.主策略仍為反彈空,除非突破站穩 $2,990–$3,080
2.跌破 $2,806 是空頭延伸開啟關鍵信號
3.OB+ $2,510–$2,590 才是主力吸籌區域,急跌需留意低多機會
4.只有放量突破 $3,080 才能改變整體偏空敘事
以上為個人觀點分享,不構成投資建議,請朋友們謹慎評估

1201 BTC早盤開殺 持續下探 日內交易計畫市場現況
BTC 昨日大跌後進入 跌後反抽修正結構
目前價格在 BB 回抽壓力帶 $86,800–$88,200 附近震盪
整體仍處於 弱勢反彈,尚未看到多頭有效止跌訊號
關鍵區域解析
92SNR 區(前高結構反壓) — $92,200
W 區(週開盤反壓) — $90,300
BB 區(回抽反彈壓力帶) — $86,800–$88,200
OB+ 區(底部吸籌 / 流動性集中) — $82,200–$82,700
0 區(深度掃流動性目標) — $80,645
交易計畫
路徑 A|反彈至 BB 受阻 → 做空(主策略)
條件: 反彈至 $86,800–$88,200 出現 上影、吞沒、縮量、M頭、Fake Break
進場: BB 高空
目標: $85,200 / $83,000 / $82,200
止損: $88,600–$88,900 上方
路徑 B|回抽 W 區受阻 → 再空
條件: 反彈至 $90,300(W 區)不破,形成轉弱K線
進場: W 區反彈空
目標: $88,200 / $86,800 / $82,700
止損: $90,800 上方
總結觀察
1.主策略保持反彈空,BB 區是最佳佈局區域
2.若回抽90,300 受阻 = 再空一次
3.下方 OB+ 區為主力吸籌位置,急跌低多可留意
4.只有站回 90,300–92,200 上方,結構才有機會扭轉偏空
以上為個人觀點分享,不構成投資建議,請朋友們謹慎評估

XAU/USD – 黃金穩健維持在上升通道內,準備衝擊全新短期 ATH黃金持續展現強勢多頭動能,並穩定維持在上升趨勢通道中。結構保持良好、宏觀面偏鴿,若流動性配合,市場正逐步為短期新高(ATH)做準備。
📊 技術展望(M30 – MMF Flow)
黃金完美尊重上升通道,每一段回調都在通道中線與下沿獲得買盤支撐。
最近一波上漲已突破 4,23x 區域,隨後回測本地流動性。
主要流動性區域(Key Liquidity Zones)
4,236 – 4,254 → 短線供應區(供給反應)
4,218 – 4,220 → 次級需求區
4,196 – 4,199 → 主要買入區(通道支撐 + 不平衡填補)
只要價格維持在 4,196 之上,結構依然看多,該區域具備以下匯合因素:
✔️ 需求區
✔️ 上升通道支撐
✔️ 費波回調位
從此區域乾淨反彈,有機會啟動下一段擴張行情。
🎯 MMF 交易計畫 – BUY 為主
情境 1 – 延續性反彈(Continuation Bounce)
Buy 入場:4,218 – 4,220
SL:4,210
TP:4,254 → 4,272 → 4,281
情境 2 – 強力掃流動性後的 BUY(RR 更佳,首選)
Buy 入場:4,196 – 4,199
SL:4,188
TP:4,236 → 4,254 → 4,281
SELL 交易(僅短線反應)
僅限在供應區短線逆勢 scalp:
4,254–4,257
4,281–4,283
→ 趨勢仍看多,因此 SELL 並非主要策略。
⚜️ MMF 觀點
黃金當前的多頭結構健康明確,液態性被有效管理,回調受控。
只要價格保持在上升通道內、並守住 4,196,市場的「最小阻力路徑」依舊向上。
突破 4,281+ 的機率極高,然後市場才可能進行更深調整。
「在多頭市場中,最好的交易永遠是逢低買進,而不是追高。」

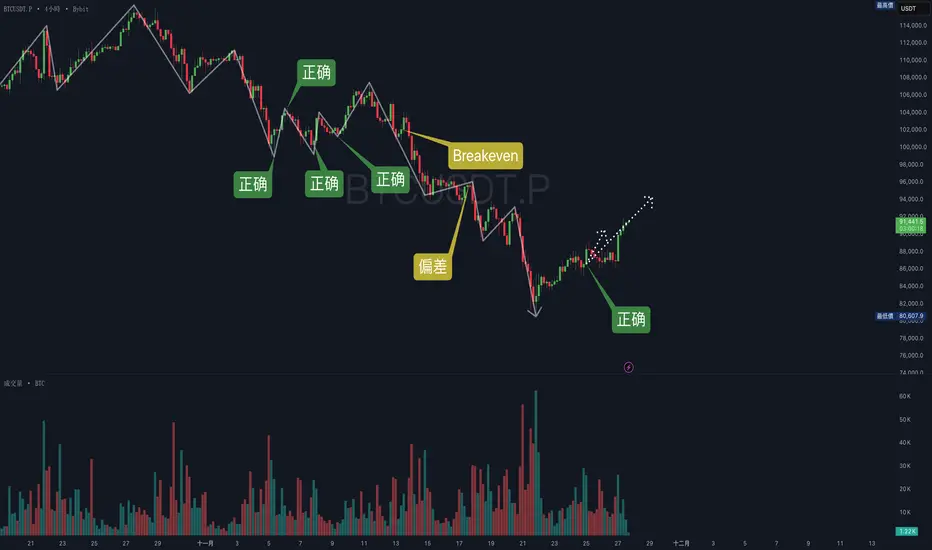
上次观点正确,平仓大部分利润,剩下的给他慢慢跑去618或者推高SL在breakeven以上20251127
最近行情的分析逐渐步入正轨
对于分享行情的开头略微有压力,会有点急切地想给出方向,但是被反噬了频繁止损
所以这几次的连胜是基于稳定的步伐才获得较好的成绩。
再接再厉,谢谢大家
XAU/USD – 黃金保持在關鍵支撐位上方,回調有限黃金在亞洲時段仍然受限於兩週高點以下,但下行明顯有限。
市場情緒受以下因素影響:
🔻 美元走弱,因市場對鴿派美聯儲預期增強
🔻 未來會議中降息的可能性上升
🔻 俄烏談判有望取得進展,全球風險情緒改善
即使黃金正在回調,只要價格保持在關鍵支撐區域上方,整體趨勢仍然看漲。
📊 技術展望 – MMF 交易風格 (M30/H1)
價格目前在阻力區 4,156 – 4,170 下方整固,回調至多個需求區。
🔑 關鍵水平
支撐 1: 4,131 – 4,137
支撐 2: 4,115 – 4,118
支撐 3 (主要流動性): 4,083 – 4,090
主要阻力: 4,170 – 4,193
市場結構顯示出清晰的鋸齒形回調,暗示一旦流動性在下方收集完畢,可能會繼續看漲。
🎯 MMF 日內交易計劃
情境 1 – 逢低買入 (主要偏好)
今日最佳交易:買入回調至需求區。
買入:4,115 – 4,118
止損:4,103
目標價:4,131 → 4,156 → 4,170
買入 (擴展流動性掃描):4,083 – 4,090
止損:4,070
目標價:4,118 → 4,145 → 4,170 – 4,193
原因:斐波那契共振 + 強需求 + 流動性區域 = 高概率反轉區域。
情境 2 – 短期賣出 (僅限短線)
僅當價格在阻力位強烈拒絕時有效。
賣出:4,156 – 4,170
止損:4,177
目標價:4,145 → 4,131
這不是今天的主要偏好。
⚜️ MMF 交易觀點
黃金正在形成健康的回調——目前階段不是看跌反轉。
只要價格保持在 4,08x 上方,看漲結構仍然完好。
“在黃金市場中,目標不是追逐突破,而是等待價格回到價值區。”
今日重點:偏好回調中的買入設置——僅在快速短線中賣出。

XAU/USD – 黃金在美元走軟和聯儲局降息前保持接近兩週高點隨著市場對聯儲局12月降息的預期增強,美元走弱,黃金繼續在近期高點附近堅挺交易。
早前的回調主要是由於股市風險偏好增強,而非黃金本身的疲弱——這意味著宏觀看漲背景仍然完好。
隨著市場現在定價:
76%的機會在12月降息,
到2026年底幾乎有90個基點的降息,
更廣泛的環境繼續支持在下跌時的上行。
📊 技術展望 – MMF 風格 (H1/H2)
價格尊重從週初低點畫出的上升趨勢線,現在正推高至0.618–0.786回撤區域之上。
🔑 關鍵水平
買入區域 1: 4,132 – 4,149 (斐波那契0.382–0.618 + 需求)
買入區域 2: 趨勢線重測區域
目標區域: 4,188 – 4,195 (1.272–1.618 斐波那契延伸)
結構目前看漲,具有明顯的更高高點和更高低點。
在繼續走高之前回撤至4,14x是最可能的情況。
🎯 MMF 交易計劃 (日內)
主要設置 – 買入下跌延續
買入: 4,132 – 4,149
止損: 4,121
獲利:
→ 4,168
→ 4,185
→ 4,192 – 主要延伸目標
替代情景 – 突破並持穩於4,170之上
如果價格在4,170之上盤整,預期將直接推向4,19x而不會有深度回調。
看跌情景 (目前概率低)
僅在價格跌破趨勢線並收於4,128以下時有效。
目標將是更深的修正至4,10x——但這不是基礎情況。
🧠 MMF 觀點
黃金的結構 + 宏觀敘述 → 看漲趨勢完好。
市場顯然在可能的12月政策放鬆前進行定位——跌至4,13x–4,14x仍然是有吸引力的機會。
“在降息環境中,黃金往往趨勢——唯一的任務是從強勢中買入,而不是追逐。”

1126 ETH 關鍵區域 多軍反攻能否成功 看這? 日內交易計畫市場現況
ETH 目前價格位於 BB 反壓帶下緣 $2,935-$2,950 一帶震盪,短線反彈屬修正結構
多頭成功回收部分失地,但 尚未站上 BB 供應區與 0.5 回撤中軸,量能不足、結構仍偏弱震盪
關鍵區域解析
BB 區(反彈壓力帶) — $2,950–$3,080 → 前波供應區 + 0.5 回撤壓力
W 區(週開盤) — $2,800 → 短線多空分界
0.5 回撤位(結構中軸) — $3,140 → 多頭最重要 突破確認位
SNR 區(中期壓力帶) — $3,395 → 若突破 0.5,為中期反彈目標
0 區(流動性集中帶) — $2,620 → 下方流動性堆疊 + OBD 吸籌
交易計畫
路徑 A|無法站上 BB → 做空(主策略)
條件: 反彈至 $2,950–$3,080 出現弱勢型態(上影/吞沒/縮量)
進場: BB 區逢高空
目標: $2,800 / $2,720 / $2,620
止損: $3,120 上方
路徑 B|站上 BB + 0.5 → 做多
條件: 突破 $3,120–$3,140 並回踩不破
進場: 回踩 0.5 中軸多
目標: $3,260 / $3,395(SNR)
止損: $3,080 下方
總結觀察
1.主策略仍為反彈空,除非突破 3120–3140
2.W 區 $2,800 是多空分水,失守看補 2620
3.突破 3140 才能走向中期反攻結構
以上為個人觀點分享,不構成投資建議,請朋友們謹慎評估

XAU/USD – 黃金突破盤整,新的牛市週期即將來臨?黃金顯示出顯著的復甦,突破了多日的橫盤區間4,00x–4,10x。強勁的買盤壓力介入,將價格推回到4100以上,表明市場可能選擇提前看漲突破,預期可能的聯儲會降息週期。
📊 技術展望 (H1/H2)
1. 結構
黃金正式突破對稱三角形態。
價格現在正在創造更高的高點和更高的低點,確認短期看漲結構。
2. 關鍵水平
買入區域 1: 4,095 – 4,100 (Fibo 0.236 + 日內需求)
買入區域 2: 4,118 – 4,122 (Fibo 0.382 + 突破回測區)
目標區域: 4,187 – 4,195 (Fibo 1.618 延伸)
3. 預期價格行動
在拒絕0.786 Fibo後,預期會有修正回調。
在下一個看漲階段之前,重新測試4,118或深度回調至4,095的可能性很高。
只要價格保持在4,095以上,看漲偏見仍然存在。
🎯 交易計劃 — MMF 風格
主要情境 – 買入回調
買入 1: 4,118 – 4,122
止損: 4,107
目標: 4,150 → 4,168 → 4,195
買入 2 (更安全): 4,095 – 4,100
止損: 4,082
目標: 4,150 → 4,170 → 4,195
如果價格突破4,165,延伸目標可能達到4,19x–4,21x。
次要情境 – 僅在強烈拒絕時賣出
在當前結構中不建議賣出。
只有在價格在4,19x附近形成假突破並確認H1上的看跌BOS時才考慮做空。
🧠 MMFLOW 視圖
黃金顯示出早期信號,表明其正在從中期下行趨勢中轉變,進入新的看漲階段。隨著技術突破確認和基本面支持(降息預期)的對齊,最小阻力的路徑是向上。
“在上升市場中,錯過趨勢的代價遠高於稍早進入。”


1124 ETH多軍底部反彈 反攻開始?日內交易計畫市場現況
目前 ETH 價格約在 $2,820 一帶,緊貼 W 區週開盤 $2,800 附近震盪
上方還有一大段空間才會碰到 日內 BB 壓力帶 $2,950–$3,080
下方則是前波反轉起漲的 OB+ 底部吸籌區 $2,510–$2,590
關鍵區域解析
BB 區(日內壓力帶)— $2,950–$3,080 前波盤整供應區(強反壓)
若反彈到此區出現 上影、吞沒、量能衰退
高勝率做空帶 / 逢高放空區
W 區(週開盤)— $2,800 短線多空分界
收不回 W 上方 = 空方主導延續
若回踩 W 守住並出現下影 + 止跌量➜ 可視為短線多單的 防守切入點
OB+ 底部吸籌區 — $2,510–$2,590
下方主要 流動性集中區 / 主力吸籌帶
若行情急跌到此區並出現 長下影 / 止跌放量 ➜ 可能成為 中期反彈起點位置(重點觀察)
交易計畫
路徑 A|反彈至 BB 區受阻 → 做空
條件:價格反彈進入 $2,950–$3,080 BB 區
出現 上影線、放量不漲、或空頭吞沒 K(搭配縮量橫盤也可以當轉弱訊號)
第一目標:$2,800(W 區回測)
第二目標:$2,590 / $2,510(OB+ 上緣與中軸)
止損:站上 $3,120 並放量收回,視為空單邏輯失效。
路徑 B|跌破 W 開 → 回踩不破做空
條件:價格 跌破 $2,800(W 區)
之後反彈 回踩 $2,800 一帶無法站回,並在 W 附近出現 轉弱 K 線(假突破、長上影、吞沒)
第一目標:$2,590
延伸目標:$2,510 OB+ 中軸
止損:回踩後若 重新站上 $2,830–$2,850 並放量,視為跌破失敗,空單需嚴格止損
總結
1.上方 BB 區 = 主力理想出貨區,高空為主,不追多
2.W 區是今天多空分水嶺:守住偏震盪,跌破偏延伸
3.OB+ 區才是中期多方真正會認真進場的區域
以上為個人觀點分享,不構成投資建議,請朋友們謹慎評估

XAU/USD – 黃金承受巨大壓力,4,000 美元突破看似迫在眉睫隨著美元走強,黃金持續下滑,這是由於美國數據的韌性所推動的。市場等待11月最後一週和即將到來的FOMC決定,避險資金流動依然疲弱,使得XAU/USD極易進一步下跌。
📊 技術展望 – H1/H30
短期結構顯然是看跌的:
1️⃣ 趨勢偏向:看跌
價格不斷拒絕下降趨勢線。
每次回調都很淺,並迅速被日內供應區吸收。
2️⃣ 關鍵技術水平
阻力 / 供應區域:
4,078 – 4,089
4,104(主要匯合:斐波 + H1供應)
支撐 / 流動性目標:
4,023 – 4,013
3,989 – 3,975 → 主要流動性區域(高反應概率)
3️⃣ 需要關注的情景
🔻 情景 1 — 繼續下跌(主要偏向)
跌破4,044 → 目標4,023,然後是3,99x – 3,97x的流動性掃描。
🔄 情景 2 — 下跌前的回調
回撤至4,054 – 4,078 → 拒絕 → 繼續下跌。
🔺 情景 3 — 更深的回升(低概率)
僅在價格收於4,104以上時有效,解鎖向4,13x – 4,15x的移動。
🎯 MMF 交易計劃
賣出 – 趨勢跟隨(主要)
賣出區域 1: 4,054 – 4,078
SL: 4,105
TP: 4,023 → 4,013 → 3,99x
賣出區域 2: 4,089 – 4,104
SL: 4,112
TP: 4,054 → 4,023
買入 – 僅作為反應交易(流動性掃描)
買入區域: 3,99x – 3,97x
SL: 3,955
TP: 4,023 → 4,054
⚠️ 買入設置是逆勢的,需要強確認。
主要偏向仍然是賣出,只要價格保持在4,104以下。
⚜️ MMFLOW 交易觀點
黃金正被推向心理4,000美元支撐。
清晰突破可能引發更廣泛的看跌擴展至3,98x – 3,95x。
隨著月末定位、FOMC預期和美聯儲情緒的轉變,波動性可能會急劇增加。
保持趨勢—賣出反彈。僅在深流動性區域有確認時買入。

XAU/USD 接近崩潰 – 空頭瞄準流動性掃描在強於預期的非農就業數據減少了近期美聯儲降息預期後,黃金仍然承壓。
美元保持適度支撐,而疲弱的風險情緒使黃金處於謹慎、防禦階段。
📊 技術快照 (H1–M30)
價格繼續拒絕下降趨勢線和供應區 4,054–4,078。
較低的高點結構保持完整 → 看跌動能仍然占主導地位。
流動性口袋位於 4,013,尤其是 3,989,這是一個關鍵的下行磁鐵。
任何向 4,054 的回調可能只是繼續下跌前的重新測試。
🎯 MMF 日內計劃
主要偏向:賣出 – 跟隨趨勢
賣出 4,054–4,078
止損:4,090
獲利:4,013 → 3,989 → 3,975
反趨勢買入(僅在深度流動性處):
買入 3,985–3,990
止損:3,972
獲利:4,013 → 4,054
⚡️ MMF 觀點
只要價格保持在趨勢線和較低高點結構之下,黃金仍處於分配階段。
在形成任何有意義的逆轉之前,3,99x 流動性區域的掃描極有可能發生。

1120 ETH 3000守不住 持續探2500 日內交易計畫市場現況
ETH 目前仍在 W 開盤下方弱勢震盪,短線結構尚未轉多
只要沒有站回 $3,090,整體依然偏空,反彈多為 修正反彈、續跌機會大
關鍵區域解析
W + 多空切換帶:$3,090
→ 當前最關鍵壓力 → 多頭必須突破並站穩,才有資格討論延伸
D 區支撐帶:$3,024
→ 今日多空分水嶺 → 跌破後若回踩不再站回來 → 空頭延伸啟動
0.5 回撤中軸:$3,020
→ 若反彈在此停滯 = 弱反彈 → 多頭要站上這裡 才能討論續攻
交易計畫
路徑 A:站上 W → 回踩做多
進場條件:突破並站穩 $3,090 回踩不破並出現強勢 K 棒(吞沒、下影、放量)
第一目標:$3,160 第二目標:$3,220–$3,260
止損:$3,060 下方
路徑 B:跌破 D 區 → 回踩不破做空
進場條件:跌破 $3,024 並放量 回踩 $3,024–$3,032 不再站回
第一目標:$2,980 第二目標:$2,920–$2,880(吸籌位)
止損:$3,055 上方
總結觀察
1.未站穩 $3,090 前,整體偏空不追多
2.$3,024 是今日多空分水嶺
3.反彈弱勢卡在 $3,020–$3,050 區間,逢高空優勢仍在
4.真正轉多一定要站穩 W,而不是猜底
以上為個人觀點分享,不構成投資建議,請朋友們謹慎評估