江恩
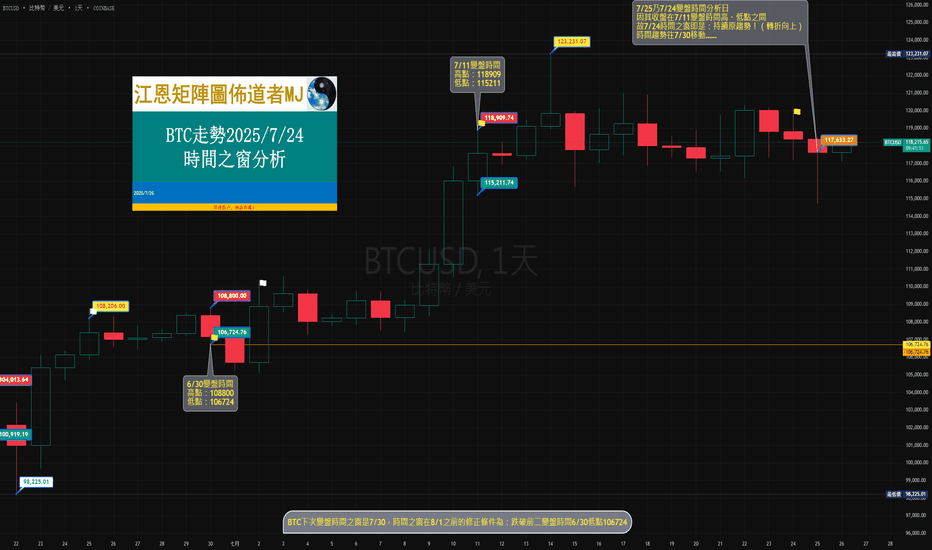
75、江恩(甘氏)矩陣圖SquaresGann~BTC走勢2024/9/5時間之窗分析9/6盤中跌破前二變盤時間8/7低點54564時,8/30時間之窗修正為:轉折向下!
9/6是9/5變盤時間分析日,以9/6修正日開盤56156、收盤53950為研判轉折標準;
9/6收盤53950,在9/6修正日開盤之下;
依“時間=趨勢”分析,9/5時間之窗即是:持續轉折向下! (參考《甘氏矩陣圖-時間推算新篇》P438)
時間趨勢往9/18移動……
時間之窗在9/20之前的趨勢修正為:越過前二變盤時間8/19高點59639。
(免責聲明:本想法所有信息僅供參考!不代表任何投資建議!!不承擔任何法律責任!!!)
COINBASE:BTCUSD
圓三、江恩(甘氏)矩陣圖SquaresGann~ETH走勢2024/8/30時間之窗分析8/23盤中越過現波段高點8/14之2780時,8/14時間之窗修正為:轉折向上!
8/27盤中跌破2650時,新波段下跌走勢形成,8/14時間之窗二次修正為:轉折向下!
8/31是8/30變盤時間分析日,以8/27二次修正日高點2699、低點2392為研判轉折標準;
8/31收盤2513,在8/27二次修正日高、低點之間;
依“時間=趨勢”分析,為持續原趨勢,8/30時間之窗即是:持續轉折向下! (參考《甘氏矩陣圖-時間推算新篇》P438)
時間趨勢往9/7移動……
時間之窗在9/9之前的趨勢修正為:越過前一變盤時間8/14高點2780。
(免責聲明:本想法所有信息僅供參考!不代表任何投資建議!!不承擔任何法律責任!!!)
BINANCE:ETHUSDT
BTC Monkey Jump again今天早上一些朋友問我昨天的buy in 我有沒有買進
一直回答有點累
之間發布一篇
順便把中間的位置也標記出來
也細部分解一下我的作法
因為是半夜 所以我沒有做
但是如果我是醒著 我會買進 但是很快就出了
This morning, some friends asked if I bought in on yesterday’s buy-in. I’ve been a bit tired from answering repeatedly. In between, I posted an update and also marked the intermediate positions.
I’ll break down my approach in detail.
Since it was the middle of the night, I didn’t trade. But if I had been awake, I would have bought in, though I would have exited quickly.
主要原因是量
這個量是不行的
起漲量放的不夠大
而最大量這跟也沒有亮點
另外 CVD 這邊也是 (我自己有畫輔助線)
沒有有效突破
RSI 不用說應該很明顯
所以當下我要不是收定後馬上出
不然我就是拉高止損到有盈利範圍
不過依照現在來看 我應該是在POE位置就放手了
The main reason is the volume. The volume is insufficient. The initial volume wasn’t big enough, and the maximum volume didn’t have any highlights.
Additionally, the CVD (Cumulative Volume Delta) also didn’t show a valid breakout (I’ve drawn auxiliary lines myself).
The RSI (Relative Strength Index) should be quite obvious.
So, at that moment, if I hadn’t exited immediately after the stop, I would have raised the stop-loss to a profitable range.
However, based on the current situation, I probably would have let go around the POE (Point of Equilibrium) position.
也因為今天這個情況的關係 以及朋友問我
讓我想到我以前畫線時 慣用的標記 陰陽線 (Ying Yang)
因為通常底部也是起漲的開始 昨天註明的SL2 也是底部 反手做多 短線也是獲利的好時機
或許我應該改回 陰陽線的標記方式
Anyways
這兩天有時間再來想想怎麼畫清楚點
回到盤面
這週末應該還是看跌為主
但是下禮拜有機會轉多
我標記了 上方有個 陰陽線 H
這個地方如果能突破站穩2到3天 那趨勢會迎來大家希望的牛
不過同樣的 如果不能 要小心另一個大幅度的調整
另外我也框了一些 我注意的地方
希望對你們有幫助
Also, due to today's situation and friends’ questions, it reminded me of the way I used to mark charts with Yin-Yang lines (陰陽線).
Usually, the bottom is also the start of a rise. The SL2 (Stop-Loss 2) marked yesterday was also at the bottom. Going long at that point was a good short-term profit opportunity.
Maybe I should revert to using the Yin-Yang line marking method.
Anyways,
I’ll think more about how to make the charts clearer when I have time in the next couple of days.
Back to the market, This weekend, the outlook should remain bearish, but next week there might be a chance for a bullish reversal.
I’ve marked an area with a Yin-Yang H. If this area can break through and stabilize for 2 to 3 days, the trend might shift to the bullish phase that everyone hopes for. However, if it doesn’t, be cautious of another significant correction.
Additionally, I’ve outlined some areas of interest. I hope this helps you.
BTC 牛在哪? Where's the bull
上篇的結尾
Last Post
“
接下來原則上 我們剩下
1.我之前偏向的紫色(紅色)
2.綠色 (現在的位置)
3.藍色
有鑑于綠色目前看起來有機會
我也另外把這個劇本的目標放上來
時間點沒錯剛好就是11月大選前
這也是為什麼我會在今天買進的原因之一
當然 我也會關注是否會在下探
走到紫色及藍色的劇本內
看下圖 你就會懂我的顧忌
另外 主圖這邊 我提供一個有可能出現的走勢
當然 這個只是一個臆測
但是依照時間推算 很有可能發生
Next, we are left with:
1 The purple (red) path I previously favored
2 The green path (current position)
3 The blue path
Given that the green path currently seems promising, I have also included the target for this scenario. The timing is just right before the November election, which is one of the reasons I bought in today.
Of course, I will also be watching for potential downturns into the purple and blue scenarios.
Looking at the chart below, you will understand my concerns:
Additionally, in the main chart here, I am providing a possible trajectory that might occur. Of course, this is just speculation, but based on the time calculation, it is very likely to happen.
”
很幸運 我在25號出清了
我手上所有的Crypto
先談談為什麼我會出清
第一 我認為時間未滿足
第二 我判斷會有第二隻腳
第三 外部原因 美股跟匯率
另外 我觀察到很多others 原則上都是上漲但是量沒有出來
甚至都是背離的情況
所以我判斷 這次跌幅不算滿足
好一點的情況是做第二隻腳
但是這隻腳的深淺 要再做觀察
54000~55000 是一個高腳區間
但我比較喜歡跌破前低 49000 在做收回
或許可以去嘗試摸通道底部 這樣對於莊家來說
籌碼也乾淨
當然 紫色跟藍色規劃我沒有忘記
這波的下跌 如果我們取6/7~7/5來計算 那大約是在 1.13~1.27之間
如果8/25是高點 那是否就非常有可能會打到紫色預測點(1.13)
反正這邊是一個可見的機會點 列入觀察
Lucky, I cleaned all of my crypto holdings on the 25th.
Let me explain why I decided to liquidate:
1 I believe the timing wasn't right.
2 I anticipated there would be a second leg down.
3 External factors such as the U.S. stock market and exchange rates.
Additionally, I noticed that many other assets have generally been rising, but the volume hasn't picked up, and there are even cases of divergence.
So I concluded that the current decline hasn't fully satisfied its potential. A better scenario would be a second leg down, but the depth of this leg still needs to be observed. The range of 54,000 to 55,000 is a high area, but I would prefer a drop below the previous low of 49,000 for a rebound. It might be worth trying to touch the bottom of the channel, which would clean up the position for the market makers.
Of course, I haven't forgotten about the purple and blue scenarios.
If we calculate the recent drop from June 7 to July 5, it falls between 1.13 and 1.27. If August 25 was the high, it is very likely that it will reach the purple forecast point (1.13). This is a visible opportunity and worth observing.
接下來我的簡易計畫有兩個部分
一個是 右側 一個左側 供參考
右側就是突破Buy-in (A) 即下單買進
止損 SL 1 (A) 及 SL ALL (A)
這個原則上偏向短單
除非量能有出來
但是注意到紫色框的部分就要考慮止盈或拉高止損到有盈利的位置
左側當然就是預計會續跌到紫色區域
這個我會先掛單 但是一樣看情況更動
其他掛單比較偏短線操作的我就不細說 但是原則上就是上面提到第二隻腳的位置
以及通道邊緣
2 simple plan for now
1 The right side, it involves breaking through the Buy-in (A) and placing a buy order. The stop-loss is set at SL 1 (A) and SL ALL (A). This approach is generally for short trades unless the volume increases. However, if you notice the purple box area, you should consider taking profits or raising the stop-loss to a profitable position.
2 The left side I anticipate further declines to the purple area. I will place limit orders for this but will adjust based on the situation.
I won’t go into detail about other limit orders that are more short-term, but generally, they relate to the second leg position mentioned above and the channel edges.
72、江恩(甘氏)矩陣圖SquaresGann~BTC走勢2024/8/7時間之窗分析8/4盤中跌破前二變盤時間7/13低點57770時,7/29時間之窗修正為:轉折向下!
8/8盤中越過8/5高點58282時,新波段上漲走勢形成,7/29時間之窗二次修正為:轉折向上!
8/8是8/7變盤時間分析日,以8/8二次修正日開盤55144、收盤61705為研判轉折標準;
8/8收盤61705,在8/8二次修正日開盤之上;
依“時間=趨勢”分析,8/7時間之窗即是:持續轉折向上! (參考《甘氏矩陣圖-時間推算新篇》P438)
時間趨勢往8/19移動……
時間之窗在8/21之前的趨勢修正為:跌破現波段低點8/5之49050。
(免責聲明:本想法所有信息僅供參考!不代表任何投資建議!!不承擔任何法律責任!!!)
COINBASE:BTCUSD
圓一、江恩(甘氏)矩陣圖SquaresGann~ETH走勢2024/8/3時間之窗分析8/1盤中跌破前二變盤時間7/13低點3113時,7/28時間之窗修正為:轉折向下!
8/4是8/3變盤時間分析日,以8/1修正日高點3242、低點3080為研判轉折標準;
8/4收盤2688,在8/1修正日低點之下;
依“時間=趨勢”分析,8/3時間之窗即是:持續轉折向下! (參考《甘氏矩陣圖-時間推算新篇》P438)
時間趨勢往8/14移動……
時間之窗在8/16之前的趨勢修正為:越過前變盤時間7/6高點3081。
(免責聲明:本想法所有信息僅供參考!不代表任何投資建議!!不承擔任何法律責任!!!)
BINANCE:ETHUSDT
六十(圓)、江恩(甘氏)矩陣圖SquaresGann~ETH走勢2024/7/28時間之窗分析7/25盤中跌破前一變盤時間7/13低點3317時,7/20時間之窗修正為:轉折向下!
7/29盤中越過7/25高點3342時,新波段上漲走勢形成,7/20時間之窗二次修正為:轉折向上!
7/29是7/28變盤時間分析日,以7/29二次修正日開盤3270、收盤3317為研判轉折標準;
7/29收盤3317,在7/29二次修正日開盤之上;
依“時間=趨勢”分析,7/28時間之窗即是:持續轉折向上! (參考《甘氏矩陣圖-時間推算新篇》P438)
時間趨勢往8/3移動……
時間之窗在8/5之前的趨勢修正為:跌破前二變盤時間7/13低點3113。
(免責聲明:本想法所有信息僅供參考!不代表任何投資建議!!不承擔任何法律責任!!!)
BINANCE:ETHUSDT
圩八、江恩(甘氏)矩陣圖SquaresGann~ETH走勢2024/7/13時間之窗分析7/11盤中越過前變盤時間5/5高點3171時,7/6時間之窗修正為:轉折向上!
7/14是7/13變盤時間分析日,以7/11修正日高點3217、低點3054為研判轉折標準;
7/14收盤3245,在7/11修正日高點之上;
依“時間=趨勢”分析,7/13時間之窗即是:持續轉折向上! (參考《甘氏矩陣圖-時間推算新篇》P438)
時間趨勢往7/20移動……
時間之窗在7/22之前的趨勢修正為:跌破前一變盤時間7/6低點2955。
(免責聲明:本想法所有信息僅供參考!不代表任何投資建議!!不承擔任何法律責任!!!)
BINANCE:ETHUSDT
圩七、江恩(甘氏)矩陣圖SquaresGann~ETH走勢2024/7/6時間之窗分析7/1盤中越過前一變盤時間6/22高點3521時,6/29時間之窗修正為:轉折向上!
7/4盤中跌破7/3低點3251時,新波段下跌走勢形成,6/29時間之窗二次修正為:轉折向下!
7/7是7/6變盤時間分析日,以7/4二次修正日高點3313、低點3050為研判轉折標準;
7/7收盤2931,在7/4二次修正日低點之下;
依“時間=趨勢”分析,7/6時間之窗即是:持續轉折向下! (參考《甘氏矩陣圖-時間推算新篇》P438)
時間趨勢往7/13移動……
時間之窗在7/15之前的趨勢修正為:越過前變盤時間5/5高點3171。
(免責聲明:本想法所有信息僅供參考!不代表任何投資建議!!不承擔任何法律責任!!!)
BINANCE:ETHUSDT
68、江恩(甘氏)矩陣圖SquaresGann~BTC走勢2024/7/6時間之窗分析7/1盤中越過前變盤時間5/8高點63013時,6/27時間之窗修正為:轉折向上!
7/3盤中跌破前波段低點5/10之60150時,6/27時間之窗二次修正為:轉折向下!
7/7是7/6變盤時間分析日,以7/3二次修正日高點62197、低點59332為研判轉折標準;
7/7收盤55854,在7/3二次修正日低點之下;
依“時間=趨勢”分析,7/6時間之窗即是:持續轉折向下! (參考《甘氏矩陣圖-時間推算新篇》P438)
時間趨勢往7/13移動……
時間之窗在7/15之前的趨勢修正為:越過前一變盤時間6/27高點62346。
(免責聲明:本想法所有信息僅供參考!不代表任何投資建議!!不承擔任何法律責任!!!)
COINBASE:BTCUSD