Unveiling the Warning Signals in Technical Analysis: When Prices
NYSE:BRK.B
Unveiling the Warning Signals in Technical Analysis: When Prices Peak and Trading Volume Surges
In the realm of technical analysis, understanding the signs when prices reach their peak and trading volume surges is critical. Dive into this informative guide to decipher these warning signals effectively.
Introduction:
Exploring the intricate world of technical analysis reveals invaluable insights into market behaviors. Among these insights lies a crucial warning: when prices soar to their peaks and trading volumes surge, it often indicates significant market movements ahead. Understanding these signals is paramount for traders and investors alike to navigate the volatile landscape of financial markets successfully.
Navigating Market Turbulence: Identifying Warning Signals
In the realm of technical analysis, the phrase "" encapsulates a pivotal concept. When prices surge to their zenith and trading volume skyrockets, it serves as a cautionary signal indicating significant market shifts. Let's delve deeper into understanding this phenomenon and its implications.
Interpreting Price Peaks and Volume Surges
When conducting technical analysis, observing price movements and trading volumes is fundamental. However, it's the convergence of these two factors that warrants attention. A scenario where prices reach their peaks accompanied by a substantial surge in trading volume suggests a crucial juncture in the market dynamics.
Analyzing Market Sentiment and Investor Behavior
At the core of technical analysis lies the study of market sentiment and investor behavior. When prices soar to their peaks, it often reflects euphoria among market participants, fueled by bullish sentiments. Concurrently, the surge in trading volume signifies heightened activity, indicating significant participation from both buyers and sellers.
Understanding Accumulation and Distribution Phases
In technical analysis, the concept of accumulation and distribution plays a pivotal role. When prices peak and trading volume surges, it may indicate the beginning of a distribution phase, where smart money or institutional investors start offloading their positions to capitalize on the prevailing market sentiment.
Navigating Volatile Markets: Strategies for Traders
For traders navigating volatile markets, recognizing warning signals is paramount. When prices peak and trading volume surges, adopting a cautious approach and implementing risk management strategies becomes imperative. This may involve adjusting trading positions, setting stop-loss orders, or diversifying portfolios to mitigate potential losses.
Strategic Insights for Investors: Long-Term Perspective
Beyond short-term trading strategies, investors can glean valuable insights from these warning signals. When prices reach their peaks and trading volume surges, it may signify overvaluation in the market. Investors with a long-term perspective can utilize this information to reassess their investment strategies and identify potential entry or exit points.
FAQs (Frequently Asked Questions)
What are the implications of prices reaching their peaks in technical analysis?
Prices reaching their peaks often indicate a potential reversal or correction in the market, prompting traders to exercise caution and adjust their strategies accordingly.
How does trading volume surge influence market dynamics?
A surge in trading volume signifies increased market activity and participation, suggesting significant shifts in investor sentiment and potential trend reversals.
What role do institutional investors play when prices peak and trading volume surges?
Institutional investors often capitalize on market euphoria by offloading their positions during distribution phases, contributing to increased trading volumes.
How can traders navigate volatile markets effectively?
Traders can navigate volatile markets by adopting cautious strategies, implementing risk management techniques, and staying informed about prevailing market conditions.
What insights can investors derive from warning signals in technical analysis?
Investors can utilize warning signals to reassess their investment strategies, identify potential opportunities or risks, and make informed decisions aligned with their long-term goals.
Are warning signals in technical analysis always accurate predictors of market movements?
While warning signals provide valuable insights, market dynamics can be influenced by various factors, and outcomes may vary. It's essential to supplement technical analysis with fundamental research and risk management practices.
Conclusion:
In the realm of technical analysis, recognizing warning signals when prices peak and trading volume surges is paramount. These signals serve as invaluable indicators of potential market shifts, guiding traders and investors in navigating volatile market conditions effectively. By understanding the implications of these signals and adopting appropriate strategies, market participants can mitigate risks and capitalize on opportunities with confidence.
============================================
在想法中搜尋"VOLUME"

SUI 的看法個人使用過 SUI 錢包,整理體驗上都不錯,有一些做法滿有趣,例如:之前玩流動池 LP質押,都是用 LP 的方式, SUI 把 LP 做成 NFT 的方式,我之前沒看過
錢包交易整體快速,還可以直接用 google 帳號連接,這真的很方便,不用去記一堆助記詞,安全性上需要再時間驗證,但看一些網路資訊,感覺不會太差
交易量每次推高都有破新高價,持有等交易量再推高時,可出一些拉回再補量,但若價格沒 ATH 可以考慮開始減碼出場,等量縮價跌再分批回補

Kaia 的看法之前 Kaly 換 Kaia 在幣安重新上幣,長期持有賺波段應該是不錯的選擇之一
目前高點交易量有破換幣時的交易量,等下次再破時可以觀察是否又有衝高交易量,可以賣出一半等拉回再補,情況不對可以全出換別的幣


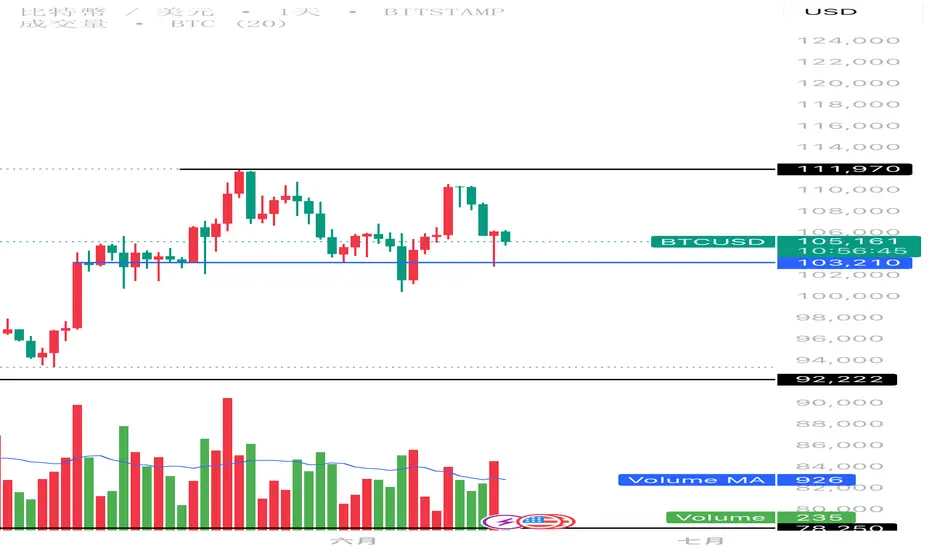
接近第一波跌幅滿足接近第一波跌幅滿足,現在看空空間較小,但長期看空不變!
若跌破第一波滿足點933以下(最好低於925),則看第二波跌幅滿足
但要注意的是,第二波跌幅滿足前的大量區(846~803)及大頸線
會有強力支撐。
注意:此貼文純屬個人研究紀錄用,非投資建議!


2023/06/25 |BTCUSDT分析|一步一步帶你解析圖表在大時間級別中,可以找到壓力區間(供給)
現在的行情走出和上一波趨勢雷同的走勢
高點到低點拉出斐波那契回撤
價格落到0.382,上升有機會到1.272~1.382
止盈出場放在1.272
趨勢1:1投射,剛好落在附近
所有我們需要的資訊都畫出來就會長這樣
不過要注意的是 成交量沒拉起來的話,很有可能會失效

BNB即將大暴跌,如果一周內漲不上去就開大倉位這波SEC風潮已經讓幣安用戶再度下降,不信邪的請去多問幾個人,像是我最近也把幣安的資產全部轉走了,BNB將會失去流動性,相關的launchpad也會遭殃,假如有被套的趕緊做空吧,比特幣預計會被下個黑天鵝帶下去,但還一堆信仰者在加倉,我就等著看,市場本來就沒有一直漲這件事情,我就講難聽一點,現在還在看多的都是韭菜,但市場不能沒有他們的貢獻


2022.11.10 BTC分析1108的策略成功达标但后续持续下跌
价格在1109精准到达了FIB 1(17554.09)的位置后有短暂反弹,
但后续多方无量,空方量能充盈。
持续看跌。
通道暂时失效,等待新的通道。


2022.10.01 本周总结本周总结
这周交易节奏不是很好
第一次判断没来得及分享
第二次判断欠缺详细的思考
虽然结果是好的但我对自己不太满意
需尽快改善
本周去杠杆获利1.5%
合约仓位获利4.5%


BTC Monkey Jump again今天早上一些朋友問我昨天的buy in 我有沒有買進
一直回答有點累
之間發布一篇
順便把中間的位置也標記出來
也細部分解一下我的作法
因為是半夜 所以我沒有做
但是如果我是醒著 我會買進 但是很快就出了
This morning, some friends asked if I bought in on yesterday’s buy-in. I’ve been a bit tired from answering repeatedly. In between, I posted an update and also marked the intermediate positions.
I’ll break down my approach in detail.
Since it was the middle of the night, I didn’t trade. But if I had been awake, I would have bought in, though I would have exited quickly.
主要原因是量
這個量是不行的
起漲量放的不夠大
而最大量這跟也沒有亮點
另外 CVD 這邊也是 (我自己有畫輔助線)
沒有有效突破
RSI 不用說應該很明顯
所以當下我要不是收定後馬上出
不然我就是拉高止損到有盈利範圍
不過依照現在來看 我應該是在POE位置就放手了
The main reason is the volume. The volume is insufficient. The initial volume wasn’t big enough, and the maximum volume didn’t have any highlights.
Additionally, the CVD (Cumulative Volume Delta) also didn’t show a valid breakout (I’ve drawn auxiliary lines myself).
The RSI (Relative Strength Index) should be quite obvious.
So, at that moment, if I hadn’t exited immediately after the stop, I would have raised the stop-loss to a profitable range.
However, based on the current situation, I probably would have let go around the POE (Point of Equilibrium) position.
也因為今天這個情況的關係 以及朋友問我
讓我想到我以前畫線時 慣用的標記 陰陽線 (Ying Yang)
因為通常底部也是起漲的開始 昨天註明的SL2 也是底部 反手做多 短線也是獲利的好時機
或許我應該改回 陰陽線的標記方式
Anyways
這兩天有時間再來想想怎麼畫清楚點
回到盤面
這週末應該還是看跌為主
但是下禮拜有機會轉多
我標記了 上方有個 陰陽線 H
這個地方如果能突破站穩2到3天 那趨勢會迎來大家希望的牛
不過同樣的 如果不能 要小心另一個大幅度的調整
另外我也框了一些 我注意的地方
希望對你們有幫助
Also, due to today's situation and friends’ questions, it reminded me of the way I used to mark charts with Yin-Yang lines (陰陽線).
Usually, the bottom is also the start of a rise. The SL2 (Stop-Loss 2) marked yesterday was also at the bottom. Going long at that point was a good short-term profit opportunity.
Maybe I should revert to using the Yin-Yang line marking method.
Anyways,
I’ll think more about how to make the charts clearer when I have time in the next couple of days.
Back to the market, This weekend, the outlook should remain bearish, but next week there might be a chance for a bullish reversal.
I’ve marked an area with a Yin-Yang H. If this area can break through and stabilize for 2 to 3 days, the trend might shift to the bullish phase that everyone hopes for. However, if it doesn’t, be cautious of another significant correction.
Additionally, I’ve outlined some areas of interest. I hope this helps you.

BTC / ETH weekly analysis (20230425)Crypto-Arsenal 加密貨幣市場周分析
BINANCE:BTCUSDT
BTC 在 26,500 - 27,000 有潛在支撐區間,相比 3 月的成交量,在 4 月份是大幅度的減少,若後續價格出現反彈,要關注上漲有無成交量增長;若無明顯增長,則需要進一步關注 28,800 附近的壓力區間,在這個區間若出現上漲疲乏,有機會產生新一輪的下跌趨勢。
BINANCE:ETHUSDT
ETH 相較於 BTC 來說已經在 1,820 - 1,840 的支撐區間做測試,這是關鍵,如果帶量的下跌跌破這個區間,3 月的上漲趨勢將會被扭轉,將比 BTC 更快形成下跌趨勢。
BINANCE:BTCUSDT
BTC has a potential support range between 26,500 - 27,000. Compared to March, the trading volume in April has significantly decreased. If there is a rebound in the subsequent price movement, it is important to pay attention to whether there is an increase in trading volume. If there is no significant increase, we need to pay further attention to the pressure range near 28,800. If there is exhaustion in the upward movement in this range, there is a chance of a new round of downward trend.
BINANCE:ETHUSDT
Compared to BTC, ETH has already tested the support range between 1,820 - 1,840. This is crucial because if the volume-driven downward movement breaks below this range, the upward trend in March will be reversed, and the downward trend will form faster than BTC.

DVP Repo transaction volumes by venue 在股市的影響DVP從高峰回落后都給股市帶來一定的影響,我把每次高峰標注出來,可以結合納斯達克走勢看到DVP回落后股市會在高峰后跟隨一個低谷。固定收益清算公司 (FICC) 的 DVP 服務。這是一個集中清算的市場,參與者知道用作交易抵押品的特定證券。它既包含非經紀活動(參與者了解其最終交易對手),也包含經紀活動(參與者不知道其最終交易對手)。由於 DVP 服務以特定證券為基礎進行結算,因此一些活動圍繞著貸方想要的證券,利用市場獲得證券的臨時所有權。
特別説明:數據滯後,不足以作爲投資依據。僅供大家娛樂。
Link:https://www.financialresearch.gov/short-term-funding-monitor/

BTC going up or down?
Review from last session (4/27):
There were two orange arrows indicating a similar magnitude to the AB=CD pattern, which leaned towards a 5-wave structure. However, the possibility of human intervention was high due to the first wave breaking. Additionally, the volume did not increase, which is another indication of intervention. There was a symmetrical pattern in the structure, and if it is valid, there is a chance of touching the upper side. At the same time, the 5-wave structure is completed.
However, it is uncertain whether there will be a big pullback before another attack. If there is, it is important to pay attention to the three red lines in the white arrow.
The downward trend line (left to right) has a high degree of stickiness, and it is likely to oscillate back and forth. The departure volume will be strong.
The line below the upward trend is the key to whether the bull will continue or not. If it breaks, be cautious of the bear's comeback. However, the pullback should not be too deep. In principle, it should be within the light-colored box or touch the orange Yin-Yang line to continue the attack.
The line above is the bullish pressure. If it cannot be attacked, there is a high probability of a quick pullback.
As expected, it came back to touch the orange line and bounced back. There is a chance of short-term attack.
Let's talk about the overall direction first. I changed the highly sticky red line to purple (some people said it would be easier to understand if I changed the color). When attacking again, pay special attention to this line. If it is unsuccessful, it will be a disaster. Especially if tested multiple times, the reaction will be more intense. In principle, whether it is up or down, it is within the range of the two red lines.
In judging, pay attention to whether the volume has increased. If the volume is still shrinking, be careful when attacking.
In the short term, pay attention to whether the short orange line can stand on the retracement and continue to attack. If it can reach the long orange line, it is normal to start the market. Stop loss can be set at the dotted line or short orange line. It depends on individual tolerance.
In principle, it is still bullish until June. However, there will still be some fluctuations in the short term. The key to stop loss is to control risk. Although it may miss some opportunities, it will not lose in the long run.
BINANCE:BTCUSDT
上期回顧 (4/27)
兩個橘箭頭 AB=CD 等幅度相近 甚至還多一些
偏向5浪結構
但一浪破位 人為操作的可能性偏大
另外量能沒有加大 也是判定是操作的原因
結構上有左右對稱的型態
如果成立上方有機會去摸
同時也完成5浪結構
唯獨是否會在來一個大回調 再攻
如果有就要注意白色箭頭那三條紅線
下降趨勢那條(左斜到右)
這條黏性很高高機率會來回盤一下
伴隨著離開量能會很強
上升趨勢下面那一條是能否續牛的關鍵 破了就要小心熊回頭
但回調應該不會走到那麼深 原則上淡色框內或碰觸橘色陰陽線
就會續攻
上面那條是多方壓力 如果攻不上 很大機率回抽會很快速
算是如預期 回來摸了橘色線就回彈
短線上再攻的機會有
先談大方向
黏性很高的紅線我改成紫色(有人反應換個顏色比較好懂)
再次上攻要特別注意這條線
不成功便成仁
特別是測試愈多次 反應會越劇烈
原則上 不管是上下
區間還是在還是上下兩條紅線內
判斷上 注意量能是否有放大
如果還是量縮上攻就要注意
短線上關注短橘線能否站上回測再往上續攻
如果能上長橘線 那開始盤一下都正常
而止損就設在虛線部份或短橘線皆可
端看個人承受能力
原則上還是看多到6月
只是短期震盪還是會有一定幅度
對於止損要拿捏好
以降低風險的角度來看
設保守雖然會錯失一些機會 但是長期而言是不會損失的
共勉之

[ETH/USD] Price Dropped like Falling into a Abyss 下降趨勢未突破,價格持續下墜Judging from the chart, the price declined with larger volumes. The price hasn't reached its floor. Since the declining trendline hasn't been broken through. The overall trend remains bearish. The support locates on USD 150.
本周下跌有帶量ˋ,只要下降趨勢線沒有突破,底部就還沒有確立,價格也就無法止跌,無法進入線型整理,目前的支撐在150。


內外盤比//@version=5
indicator("內外盤比", overlay=false)
// 計算外盤和內盤成交量
buyVolume = close > open ? volume : 0
sellVolume = close < open ? volume : 0
// 計算內外盤比
innerOuterRatio = buyVolume / (sellVolume + buyVolume)
// 顯示結果
plot(innerOuterRatio, title="內外盤比", color=color.blue, linewidth=2)
hline(1, "1:1", color=color.red)
