Can Comfort Systems Maintain Growth As HVAC Consolidator?
Business Overview
Comfort Systems USA (FIX:NYSE), founded in 1997 from the merger of 12 companies, and headquartered in Delaware, is a company that provides mechanical and electrical contracting services (commonly referred to as MEP systems) across the United States. Over the last decade, Comfort Systems USA has increased its operating units by 20%, from 38 to 47, and its locations by almost 50%, going from 92 to 178 locations across 136 U.S. cities. The company operates in a highly fragmented and localized market, where its corporate-level strategy has heavily relied on acquisitions. By acquiring smaller players with strong regional footholds, stable cash flows, or specialized capabilities (such as modular construction), the company has been able to diversify its offerings and strengthen its presence across different geographies and customer segments. This is especially important because construction demand is tied to economic cycles and regional recessions.The company's core revenue comes from two segments: mechanical services (78.7% of 2024 revenue), which include HVAC, piping, plumbing, and off-site construction, and electrical services (21.3%), focused on installing and servicing building electrical systems.
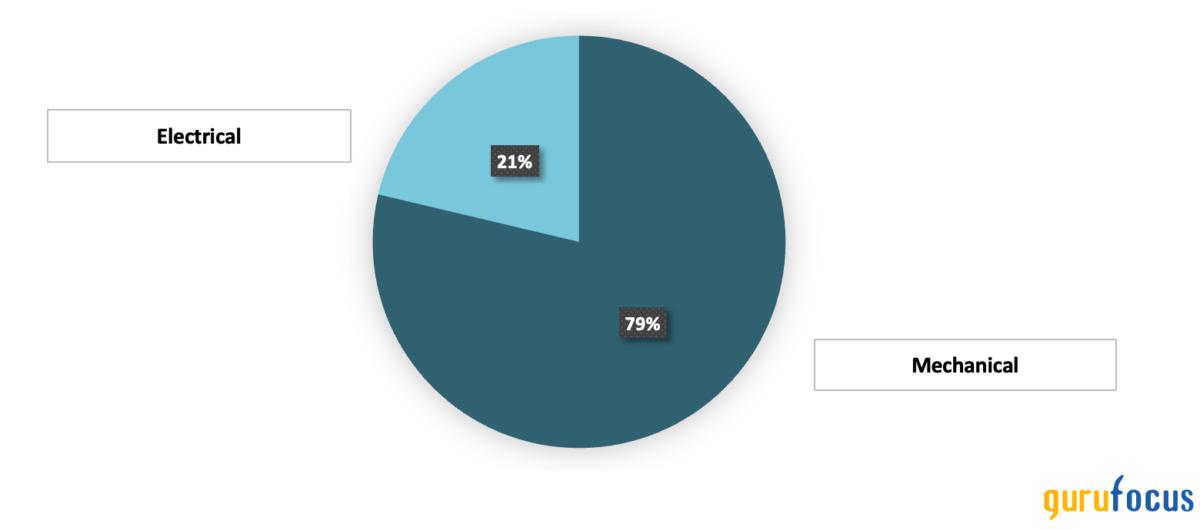
Core Revenue Segmentation by Service Line (Comfort Systems USA Investor Presentation, May 2024)
Revenue is further split between installation projects for new buildings (56.7%) and maintenance work on existing facilities (43.3%). Management is investing in both areas, particularly modular and recurring maintenance work, given their strong growth potential. By end market, Comfort Systems serves three major client types: institutional customers like hospitals and schools (23%), commercial properties (17%), and industrial clients (60%). The latter is largely driven by manufacturing and the fast-growing tech/data center segment.
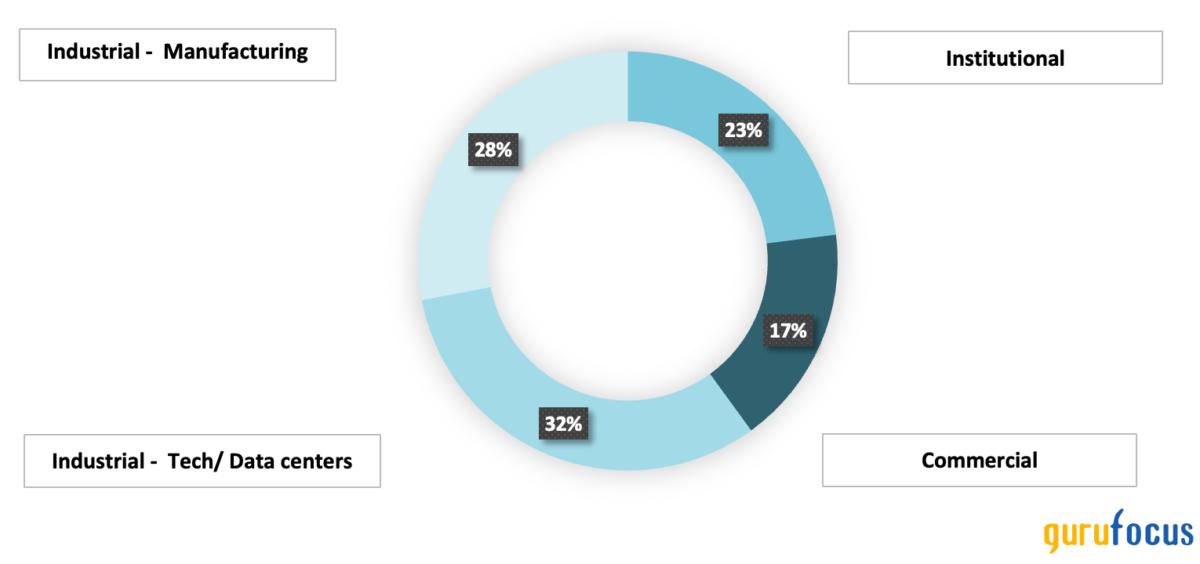
End Market Segmentation of Revenue (Comfort Systems USA Investor Presentation, May 2024)
Macroeconomic Outlook
When looking at key Trends, they mirror the nonresidential construction sector (Investment in buildings, hospitals, factories, etc), we see that it is sensitive to macroeconomic variables such as GDP growth, interest rates, investment and public budgets. Indeed, larger, complex projects are often delayed during downturns due to uncertainty. However, as of now, the outlook for nonresidential construction remains positive. The value of private nonresidential construction is currently (2025) estimated at $$177.06 billion and is projected to grow at a sustained CAGR of 2.06% with a Forecasted value in 2030: $196.10 billion. This growth is expected to be driven partly by anticipated declines in interest rates. Lower rates will likely stimulate borrowing to finance new projects, particularly in the data center market. This growth will be supported by President Trump's recently announced Stargate Project, which plans to invest up to $500 billion in AI infrastructure through 2028. The increased demand for data centers, known for their high energy consumption, will also necessitate greater spending on energy infrastructure(IBIsworld, 2025).
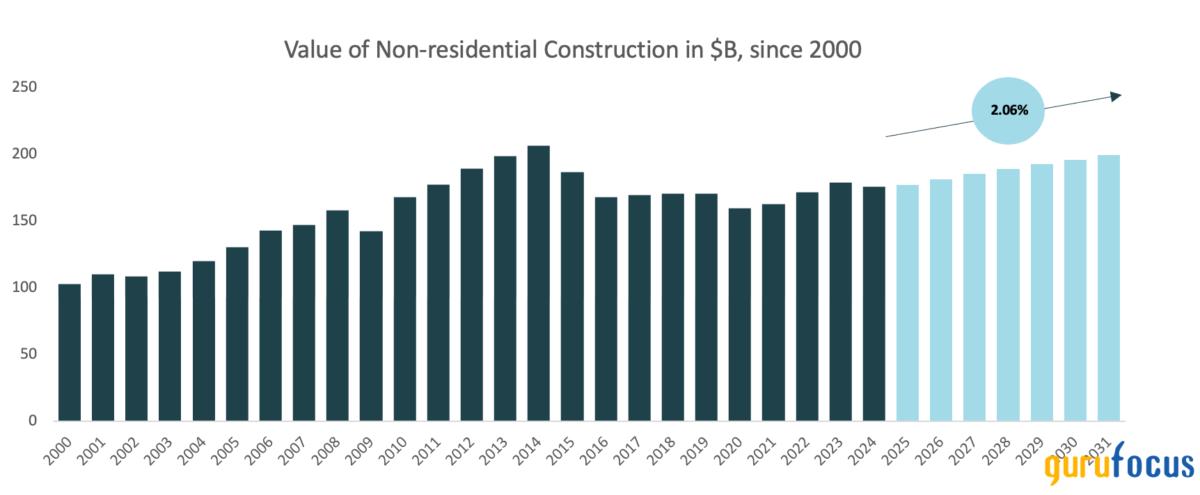
Forecasted Value of Nonresidential contraction (Ibisworld, 2025)
Despite the anticipated expansion, some of the growth will stem from higher construction costs given the Trump administration's new immigration policy, which aims to deport millions of undocumented immigrants. With many working in the construction sector will surely drive up costs. Additionally, potential tariffs of 10% on goods from China and 25% on imports from Canada and Mexico, as discussed by President Trump, though some of them paused, contribute to the uncertainty which continues to impact input prices. These factors are likely to increase the costs new construction projects, contributing to growth in the overall value of construction.
Industry Analysis
Doing a structural analysis of the forces in this industry, we see that buyers have some bargaining power on new buildings, especially sub-$2 million, as they look for the lowest price. But at the higher end, for $10M+ contracts, the larger companies with superior capabilities in labor and experience have more leverage. This dynamic reinforces the importance of Comfort's local scale and decentralized model, which help it remain price-competitive for small jobs while still delivering complex services for larger clients.
With regard to suppliers, it seems suppliers have non negligible power with respect to Comfort, with companies like Caterpillar being much larger, making it harder to negotiate on certain specialized equipment. Theoretically, though, they pose a potential threat of forward integration to strengthen their existing arms through acquisitions, given that they are already present in adjacent MEP markets and have more financial resources and vertical integration (including manufacturing and supply capabilities). However, Comfort appears to mitigate this risk by maintaining hundreds of suppliers and managing procurement regionally, which gives it flexibility and reduces dependency on any single vendor. Now in terms of rivalry, there is a fragmented market across the U.S., with a lot of smaller players competing on price, and some larger players (including vertically integrated firms) who compete directly with Comfort on larger projects. Comfort also competes with National chains like ARS/Rescue Rooter and Service Experts, as well as regional players. Its edge lies in integrating acquisitions more seamlessly than rivals where they have make full use of their centralized back-office while keeping local customer relationships and autonomy. Unlike some consolidators that struggle to maintain service quality after acquisitions, Comfort Systems' approach has resulted in 26 consecutive years of positive free cash flow and a growing backlog - proof of the sustainability of its model.
Competitive Advantage
Their sustainable competitive advantage lies in their corporate strategy which relies on value-creating diversification via acquisitions to (1) broaden their service lines, (2) increase market power, and (3) decrease concentration risk. It essentially, it allows them to:
- Increase Market power: they have developed Operating leverage pointing towards synergies in cost. Here, their Centralized SG&A (admin for HR, safety, insurance, training, etc) allows for lowering overall costs. when modeling SG&A/revenue, it is reducing over time.
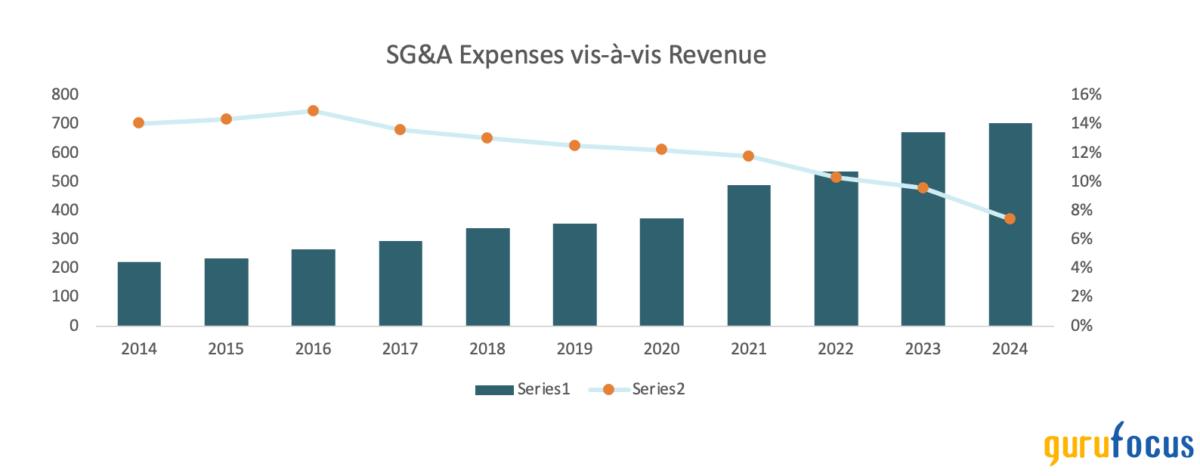
SG&A expense ratio from 2014 onward (Author)
2. Leverage Operational & corporate relatedness: Corporate relatedness allows for Resource sharing and transfer of core competencies through their decentralized model. On the other end, operational relatedness of the various SBUs allows for Centralized fabrication, Shared labor/engineering across units this comes with Benefits in flexibility and productivity. For instance, after the Walker Engineering acquisition, Comfort Systems centralized Walker's HR and procurement functions, which allowed both entities to benefit from lower insurance premiums and bulk purchasing discounts. This contributed to a steady decline in SG&A as a percentage of revenue, as shown in the accompanying graph.
3. Develop New capabilities : Have the ability to develop new competencies in key markets via strategic acquisitions. (ex. Walker acquisition - Electrical/data center infrastructure to strengthen Tech segment access & cross-sell MEP services)
Investment Thesis
Comfort Systems USA (FIX:NYSE) appears to be a little undervalued, and thus is rated a Buy with a target price range of $481$497 with a potential upside to 534$. The recommendation is driven by the following key points:
1. Sustained growth in nonresidential construction: The increase in the value of private nonresidential construction, coupled with the $500 billion investment in AI and data center infrastructure, makes it plausible to believe that growth in the AI sector will be sustained. This will support elevated revenue levels over the coming years.
2. Proven M&A execution: Comfort Systems has also demonstrated the ability to execute acquisitions at a high level to grow inorganically, having completed, on average, more than one acquisition per year throughout its existence. This inorganic growth strategy, paired with ongoing sector tailwinds, has contributed to a revenue CAGR above 20% over the last 10 years.
3. Favorable financing environment: Anticipated declines in interest rates will likely stimulate borrowing to finance new projects, particularly in the data center market. This is further supporting continued revenue growth.
Financial Analysis
Looking at the company's profitability, Overall, the company has decent and stable operating margins in line with industry averages of 8-10%.
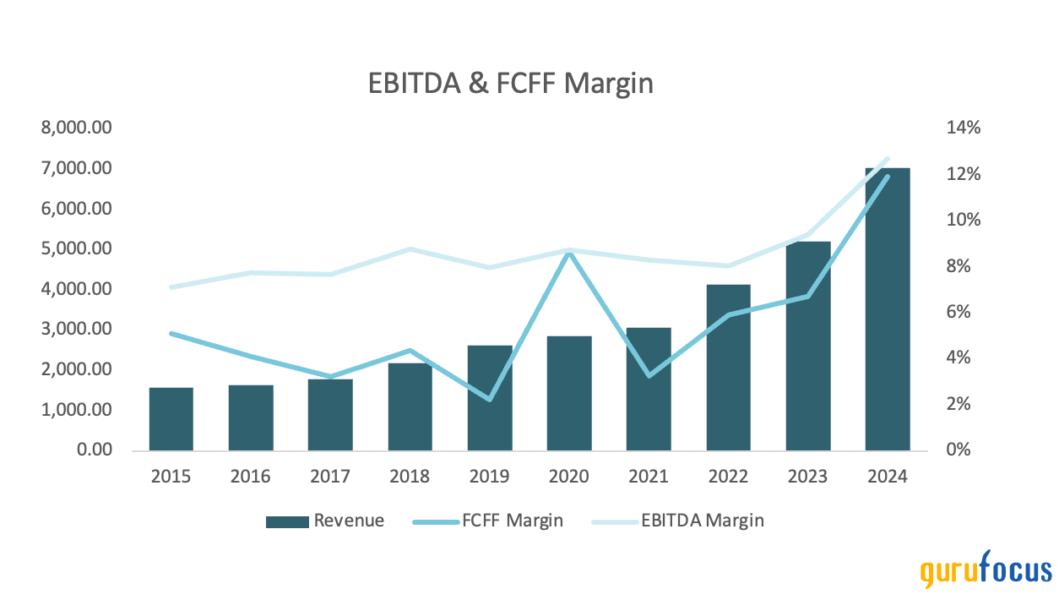
Historical Revenue, FCFF Margin, EBITDA margin (Seeking alpha & Own modeling)
Though ROE stands at 37% almost 2x that of the sector median with limited usage of debt. These levels are expected to remain strong as the company is investing in buy and build projects and its maintenance services which drives a lot more cashflows.
When it comes to growth, the firm has delivered a revenue CAGR of ~20% for the last decade, despite the negative impact from Covid-19. It is reasonable to assume that the company will continue in that trajectory, with growth fueled by new acquisitions, growth in the value of nonresidential construction, 500B investment in AI infrastructure, and expected lower interest rates.
Lastly, the firm has consistently provided value to Shareholders with Historical ROIC of 17%, above the current WACC 8.5% based on its current capital structure.
Valuation
For the DCF, a forecasted base case target price of 481$-497$ represents a fair value estimate upside as per rigorous assumptions:
- Revenue Growth will stay at current levels for the growth period, meaning at least 20%-25% for the next 5 years which has been their average growth since 2015 this is supported by current macroeconomic factors, such as increase in the value of non-residential construction by 2030, investment in AI infrastructure and lower interest rates.
- We assume that FCFF will remain strong at 12% or above which is above their 10 year average of 6%; this appears plausible due to the effect of operating leverage and ongoing realized synergies from past acquisitions. This will lead to lower costs over time and preservation of current cashflow margins.
- Exit EV/EBITDA Multiple is assumed to be equal to sector median of about 12x to stay conservative.
For the upside case - we forecasted a share price of 481$-553$ due to a more aggressive growth rate of 25%-30% of implied EV/EBITDA multiples of 13x-15x respectively, holding everything else constant.
As per comps we found that the company would be overvalued if it were to be traded at current multiples with a fair valuation range of 276-385, but this valuation seems overly pessimistic given how ROE & ROIC significantly outperform the industry benchmarks.
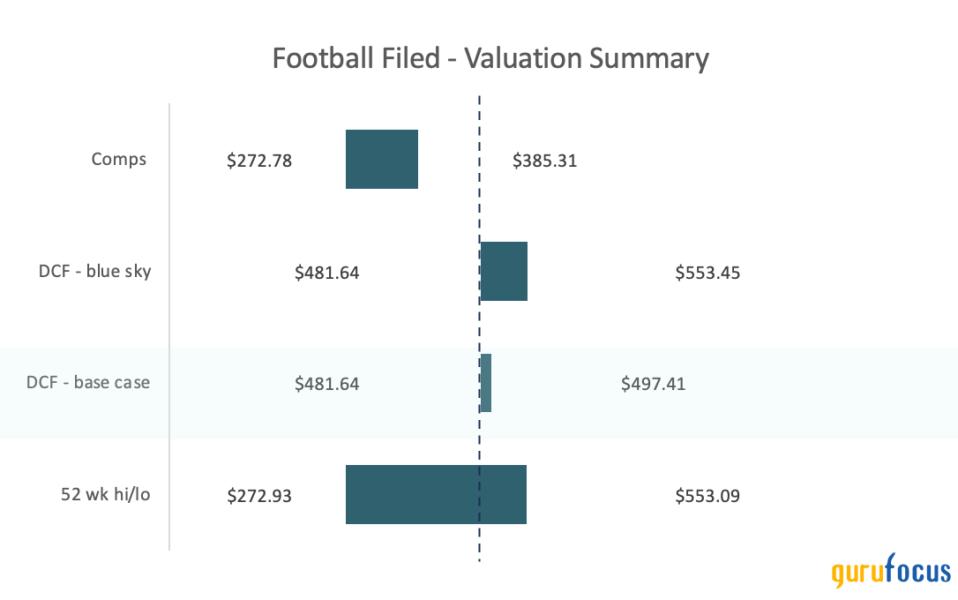
Valuation Summary - Football Field (Author with Financial data from 10-K)
Catalysts
Near Term (0-6 months) - Q2 2025 earnings report (July 22):
- Quarterly EPS beat vs. consensus of 4.83
- YoY revenue growth > 20%, especially in Q2/Q3 (typically strongest quarters).
- Watch for FCF margins ? 12%
Medium term (6-12 months)
- Buybacks or Insider Buying; Share buybacks in 10-Qs or press releases (like $92M in Q1). Continued trading activity in the following quarters would suggest management's confidence in the company.
- New Acquisitions Announced or Closed
- Q3 2025 earnings (late October): Typically, the strongest quarter seasonally
- Macro tailwinds: Potential Fed rate cuts, Progress on AI infrastructure investment (Stargate Project)
Risks
- DCF assumptions may be optimistic: Base case assumes a continuation of 2025% revenue CAGR and 12%+ FCF margins for the next 5 years. These are materially above Comfort's 10-year averages and depend on high backlog conversion efficiency, sustained growth in data center/tech segments, and M&A execution. Any normalization of margins to historical levels (68%) would compress valuation meaningfully.
- FIX has a large and growing backlog ($5.99B), though it may not convert fully to revenue or profitably. Projects can be delayed, resized, or canceled. with High terminal value sensitivity of 70% of equity value driven by the terminal value in the model, small changes in WACC, growth rate, or margins significantly impact the output.
Should You Buy Now?
The company is repurchasing shares at levels that has not been seen before.
- Bill George, Chief Executive officer:
We just spent $92 million in the first quarter on shares because we thought we were able to buy our shares at 12x times trailing EBITDA. And we thought that is a fantastic use of our capital
This is the company's largest single-quarter buyback in recent history. Further, with over 90% institutional ownership, 324 funds increased their positions last quarter compared to 288 funds reducing (or most likely rebalancing to reduce exposure to growth) this shows that the trend tilts clearly towards a buy for the company. The firm has great financials, a fortress-like balance sheet, plenty of cash available for acquisitions, very little debt, and a strong ability to borrow to finance growth. Wall Street analysts have a consensus one-year price target of $500 on the company on par with our base case - though we also predict 553$ for our bullish scenario, pointing towards an approximate 5% upside for the base case, with a potential of 16% for the bullish case.