Use implied volatility as probable top finder: Shubham Agarwal
Implied Volatility or IV is an integral part of Option premium. As all of us know Option Premium is a calculated figure based on following:1. Price of the stock/index2. Strike Price3. Expiry Date (time to that date)4. Rate of Interest
5. Volatility
Out of these 5 factors first 4 factors are known and same for each one of us. Volatility figure, however, is not a simple figure as it needs to be calculated and is not readily available anywhere.
On the other hand, the answer to these 5 factors’ calculation is available in the market (market traded Option Premium). So, if we have 4 out of 5 factors and the answer (premium), we can find the last factor of volatility by back calculating the same.
Volatility thus calculated is called Implied Volatility (implied by the price of the option). What makes this interesting is the following chart.

This is the chart of an index along with the implied volatility of its ATM Strike (closest to its Future’s price) Option. 2 things are visible.
1. Futures and IV are generally moving in opposite directions. The bottom of one and the top of the other is happening at the same time.
2. IV as can be seen over a period of 5 months has not gone distance. So, safe to say it moves in a range.
Combination of these 2 factors is what makes IV interesting. IV moving in a range makes it more predictable. Predictability of the IV may not be easily tradable for many but the negative relationship of IV with Futures can help in identifying expected Futures movement.
Range bound is easy to trade due to the very returning back to the centre of the range characteristic. However, for this to be traded one needs to know the bounds of the range bound. Meaning, one needs to find how high is too high and how low is too low.
One of the techniques especially for IV being used globally is IVR. IVR stands for Implied Volatility Rank. This is one of the simplest indicators of extremes in Implied Volatility.
Generally looked over a past period. In our instance we will consider last 250 days. That is the popular period of observation (250 trading days is approximately a year).
IVR will be 100 if the IV is at the highest point for last 250 days and 0 if the IV is at the lowest point of the last 250 days.
The reason why we use this is because it does not remain at the lowest point or highest point for a long time. The chart shows the same.
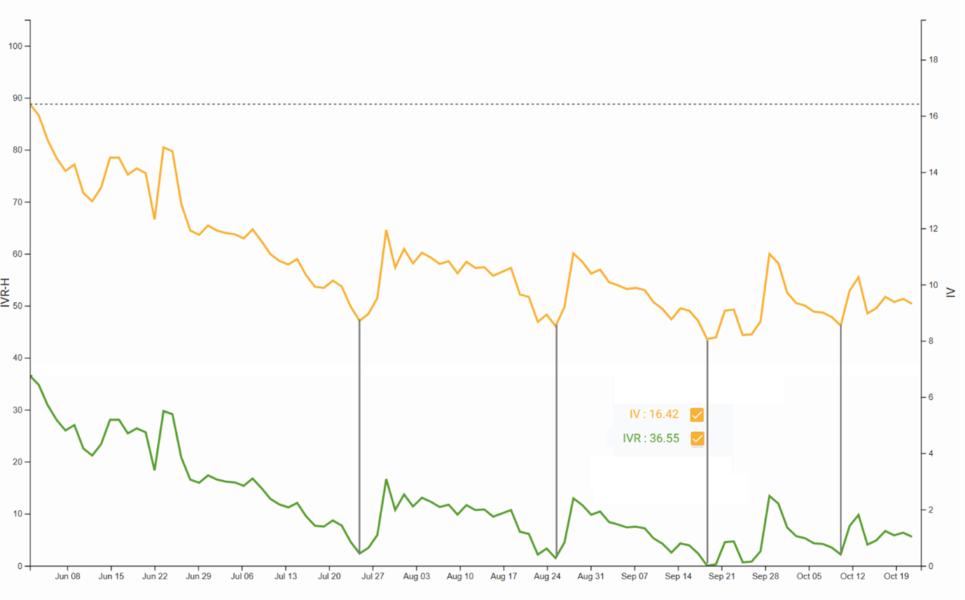
IVR of below 5 does not sustain and hence a reading of a rise after going below 10 has helped IV to turn around. Let us put both the charts together and see if IVR helps.
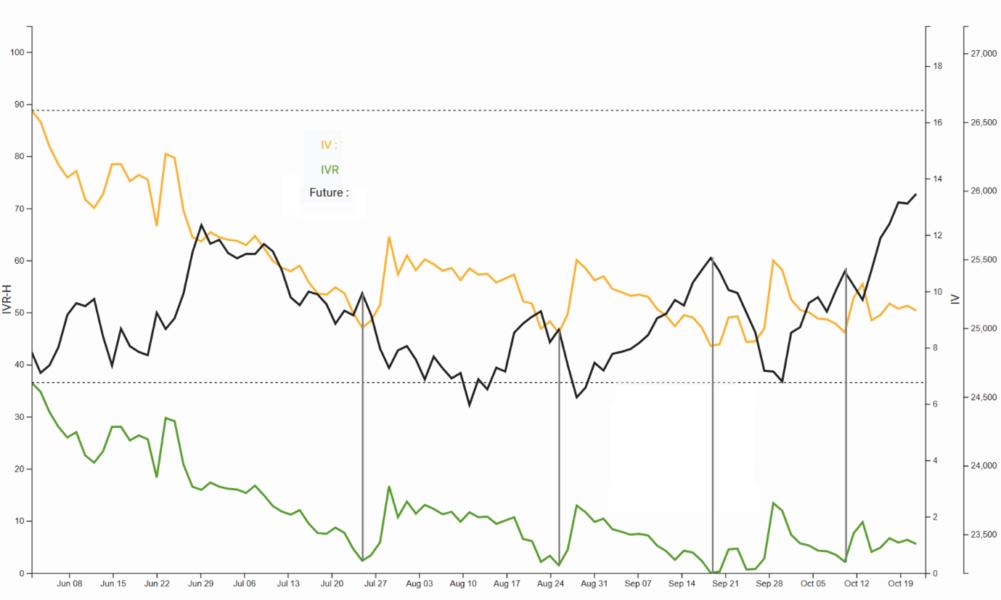
Picture says 1000 words. Same lines have been able to identify the Tops. The charts of IV are easily available. Alternatively, for Nifty India VIX can also be used as a proxy to its IV.Disclaimer: The views and investment tips expressed by experts on Moneycontrol.com are their own and not those of the website or its management. Moneycontrol.com advises users to check with certified experts before taking any investment decisions.