OPEN-SOURCE SCRIPT
RSI of MAs
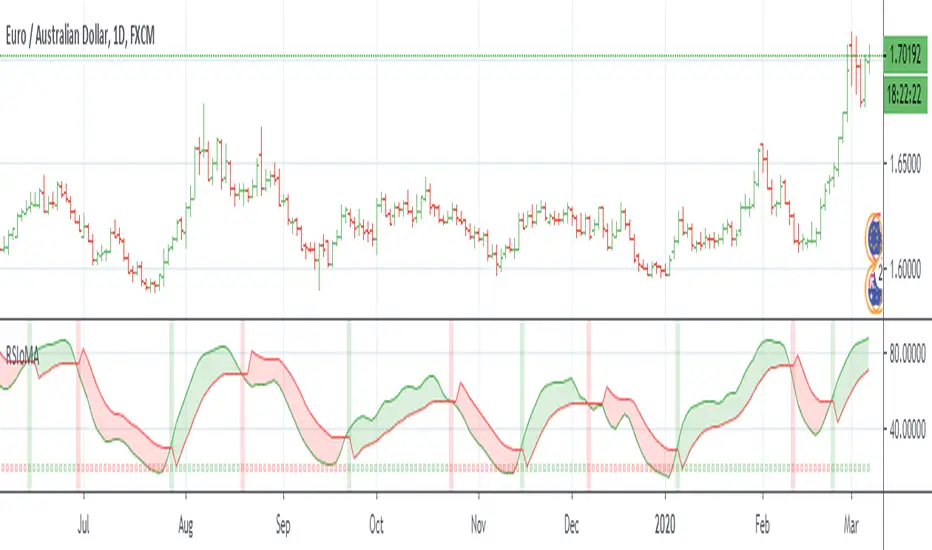
RSI of MAs is designed to calculate the moving average for a specific period, and then take the RSI of that value. This script allows the user to select which moving average they would like to utilize for the calculation, as well as customizing how the Signal Line is calculated. There are many combinations available and you will need to tune the indicator to fit your trading style. The Signal Line is designed to indicate when there is a potential change in price action. If the Signal Line is below RSIoMA, price is bullish. If the Signal Line is above RSIoMA, price is bearish.
MA Period is the length/period the moving average is calculated with
RSI Period is the length/period the RSI is calculated with
RSI MA Mode determines which moving average is applied to the MA period
Signal Line determines which moving average or QQE is used to calculate the signal line
Signal Line Period is the length/period the Signal Line is calculated with
As always, trade at your own risk.
Multiple MA Options Credits to Fractured
Signal Line Options Credits to lejmer
Bits and Pieces from alexgrover, montyjus, and jiehonglim
開源腳本
本著TradingView的真正精神,此腳本的創建者將其開源,以便交易者可以查看和驗證其功能。向作者致敬!雖然您可以免費使用它,但請記住,重新發佈程式碼必須遵守我們的網站規則。
免責聲明
這些資訊和出版物並不意味著也不構成TradingView提供或認可的金融、投資、交易或其他類型的意見或建議。請在使用條款閱讀更多資訊。
開源腳本
本著TradingView的真正精神,此腳本的創建者將其開源,以便交易者可以查看和驗證其功能。向作者致敬!雖然您可以免費使用它,但請記住,重新發佈程式碼必須遵守我們的網站規則。
免責聲明
這些資訊和出版物並不意味著也不構成TradingView提供或認可的金融、投資、交易或其他類型的意見或建議。請在使用條款閱讀更多資訊。