OPEN-SOURCE SCRIPT
ETS Prox Cumulative Volume Delta BB
This script is based on the work originally done by kprsa for the Monster Cumulative Delta indicator, but adds Bollinger Bands and upgrades it to version 4 from version 1.
It is an approximation of the Cumulative Delta Volume that is usually based on volume differences between market and limit orders, but because that data is not available, this indicator allocates a portion of the volume of a candle to the "upward" and "downward force" of each candle.
The upward force of a "Buy" candle is calculated by the High-Low
The downward force is calculated by (High-Close)+(Open-Low)
"Sell" candles are calculated in the same way just opposite
Total force=up force + down force
Up volume approximation = candle volume * up force/total force
Down volume approximation = candle volume * down force/total force
The result is similar to OBV, but not exactly the same, and allows for a "candle size" which you can't get with On Balance Volume.
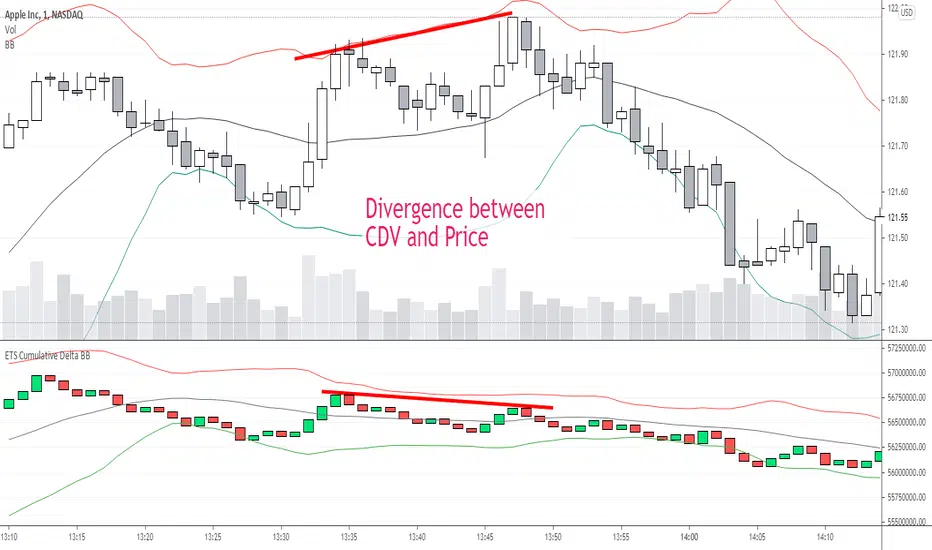
I had never used a Cumulative Delta Volume indicator before, but when I started using it myself, it proved very effective when there was a deviation from price. It was also very effective in my opinion when Bollinger Bands was added to assess the standard deviation of the CDV compared to the Bollinger Band of price and looking for areas where the CDV reaction to hitting or getting close to the BB was different.
I hope you find it useful! Of course, it comes with no guarantee of profits or any investing advice whatsoever.
It is an approximation of the Cumulative Delta Volume that is usually based on volume differences between market and limit orders, but because that data is not available, this indicator allocates a portion of the volume of a candle to the "upward" and "downward force" of each candle.
The upward force of a "Buy" candle is calculated by the High-Low
The downward force is calculated by (High-Close)+(Open-Low)
"Sell" candles are calculated in the same way just opposite
Total force=up force + down force
Up volume approximation = candle volume * up force/total force
Down volume approximation = candle volume * down force/total force
The result is similar to OBV, but not exactly the same, and allows for a "candle size" which you can't get with On Balance Volume.
I had never used a Cumulative Delta Volume indicator before, but when I started using it myself, it proved very effective when there was a deviation from price. It was also very effective in my opinion when Bollinger Bands was added to assess the standard deviation of the CDV compared to the Bollinger Band of price and looking for areas where the CDV reaction to hitting or getting close to the BB was different.
I hope you find it useful! Of course, it comes with no guarantee of profits or any investing advice whatsoever.
開源腳本
本著TradingView的真正精神,此腳本的創建者將其開源,以便交易者可以查看和驗證其功能。向作者致敬!雖然您可以免費使用它,但請記住,重新發佈程式碼必須遵守我們的網站規則。
Doing what I can to help people trade better. Past performance doesn't guarantee future results. Trade at your own risk. This is not financial advice, it is personal opinion, I'm not a financial adviser. I may have a stake in what I write about.
免責聲明
這些資訊和出版物並不意味著也不構成TradingView提供或認可的金融、投資、交易或其他類型的意見或建議。請在使用條款閱讀更多資訊。