OPEN-SOURCE SCRIPT
已更新 US 20Y Treasury Yield
What This Indicator Does
This Pine Script creates a custom indicator for TradingView that displays the US 20-Year Treasury Yield (US20Y) on your chart. Here's what it does step by step:
1. What Is the US 20-Year Treasury Yield?
The US 20-Year Treasury Yield is a financial metric that shows the interest rate (or yield) investors earn when they buy US government bonds that mature in 20 years. It’s an important indicator of the economy and can influence other markets like stocks, bonds, and currencies.
2. How Does the Indicator Work?
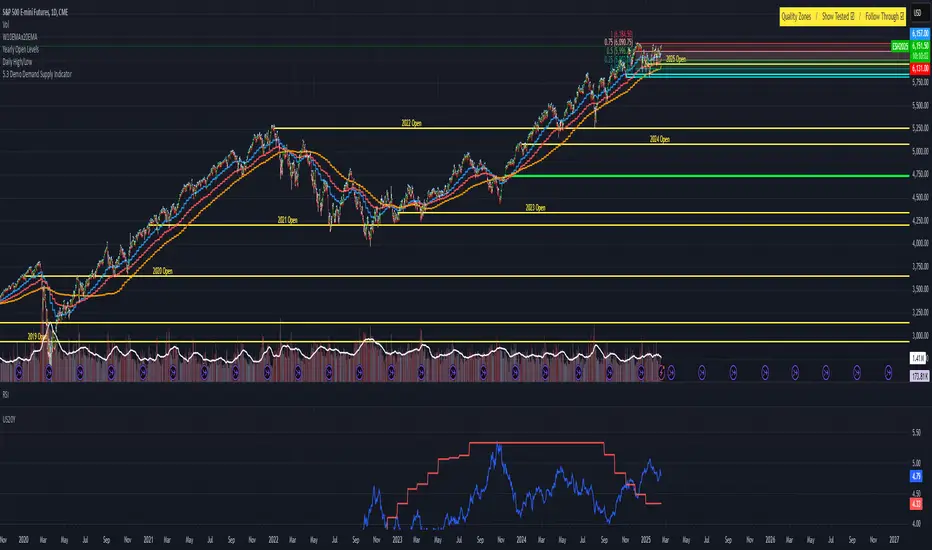
The indicator fetches the latest data for the US 20-Year Treasury Yield from TradingView's database.
It then plots this data in a separate pane below your main chart, so you can easily monitor the yield without cluttering your price chart.
3. What Does the Indicator Show?
A blue line is drawn in the separate pane, showing the movement of the US 20-Year Treasury Yield over time.
A gray dashed line is added at the 4.0% level as a reference point. You can use this line to quickly see when the yield is above or below 4.0%.
5. Why Use This Indicator?
Monitor Economic Trends : The US 20-Year Treasury Yield is a key economic indicator. By plotting it on your chart, you can stay informed about changes in interest rates and their potential impact on other markets.
This Pine Script creates a custom indicator for TradingView that displays the US 20-Year Treasury Yield (US20Y) on your chart. Here's what it does step by step:
1. What Is the US 20-Year Treasury Yield?
The US 20-Year Treasury Yield is a financial metric that shows the interest rate (or yield) investors earn when they buy US government bonds that mature in 20 years. It’s an important indicator of the economy and can influence other markets like stocks, bonds, and currencies.
2. How Does the Indicator Work?
The indicator fetches the latest data for the US 20-Year Treasury Yield from TradingView's database.
It then plots this data in a separate pane below your main chart, so you can easily monitor the yield without cluttering your price chart.
3. What Does the Indicator Show?
A blue line is drawn in the separate pane, showing the movement of the US 20-Year Treasury Yield over time.
A gray dashed line is added at the 4.0% level as a reference point. You can use this line to quickly see when the yield is above or below 4.0%.
5. Why Use This Indicator?
Monitor Economic Trends : The US 20-Year Treasury Yield is a key economic indicator. By plotting it on your chart, you can stay informed about changes in interest rates and their potential impact on other markets.
發行說明
1. What Is the US 20-Year Treasury Yield?The US 20-Year Treasury Yield is a financial metric that shows the interest rate (or yield) investors earn when they buy US government bonds that mature in 20 years. It’s an important indicator of the economy and can influence other markets like stocks, bonds, and currencies.
2. How Does the Indicator Work?
The indicator fetches the latest data for the US 20-Year Treasury Yield from TradingView's database.
It then plots this data in a separate pane below your main chart, so you can easily monitor the yield without cluttering your price chart.
3. What Does the Indicator Show?
A blue line is drawn in the separate pane, showing the movement of the US 20-Year Treasury Yield over time.
A gray dashed line is added at the 4.0% level as a reference point. You can use this line to quickly see when the yield is above or below 4.0%.
開源腳本
秉持TradingView一貫精神,這個腳本的創作者將其設為開源,以便交易者檢視並驗證其功能。向作者致敬!您可以免費使用此腳本,但請注意,重新發佈代碼需遵守我們的社群規範。
免責聲明
這些資訊和出版物並非旨在提供,也不構成TradingView提供或認可的任何形式的財務、投資、交易或其他類型的建議或推薦。請閱讀使用條款以了解更多資訊。
開源腳本
秉持TradingView一貫精神,這個腳本的創作者將其設為開源,以便交易者檢視並驗證其功能。向作者致敬!您可以免費使用此腳本,但請注意,重新發佈代碼需遵守我們的社群規範。
免責聲明
這些資訊和出版物並非旨在提供,也不構成TradingView提供或認可的任何形式的財務、投資、交易或其他類型的建議或推薦。請閱讀使用條款以了解更多資訊。