INVITE-ONLY SCRIPT
MTPI TOTAL / BTC | JeffreyTimmermans
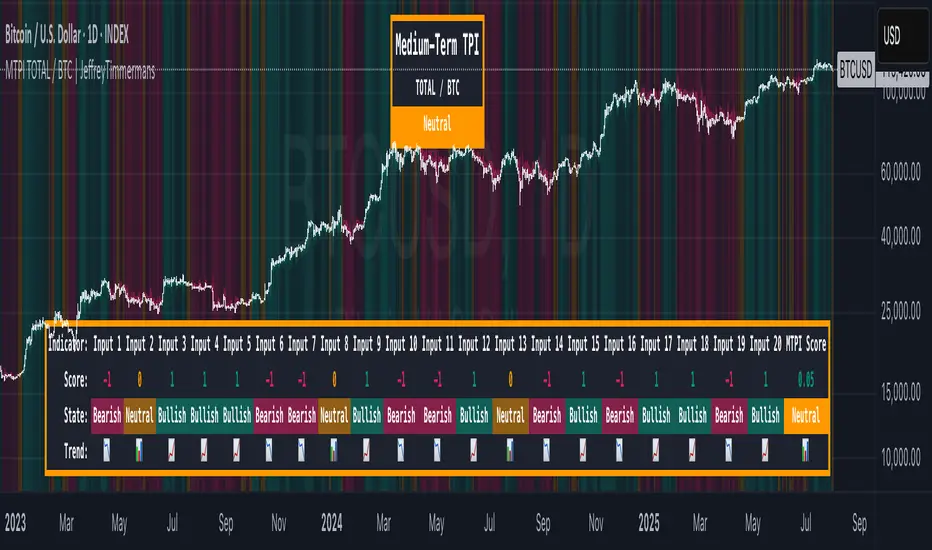
Medium-Term Probability Indicator (MTPI)
The "Medium-Term Probability Indicator (MTPI)" is a multi-factor model designed to evaluate the medium-term state of a market. By aggregating signals from 20 underlying inputs, it generates a composite score that classifies the market as Bullish, Bearish, or Neutral. This helps traders understand the prevailing market regime and adapt strategies accordingly.
Key Features
Inputs & Settings
MTPI Settings:
Color Settings:
These colors can be customized as desired.
Calculation Process
Signal Aggregation:
Each input generates a state:
Scoring:
The MTPI aggregates these values and calculates an average score.
Classification:
Visualization:
How to Use the MTPI
Identifying Market Regimes:
Transition Detection:
Dynamic Dashboard:
Conclusion
The Medium-Term Probability Indicator (MTPI) consolidates multiple signals into a single, intuitive visualization that helps traders quickly assess the medium-term market environment. Its combination of a multi-input dashboard, composite scoring, and background coloring makes it a powerful decision-support tool.
This script is developed by Jeffrey Timmermans and is designed to complement other analysis methods.
The "Medium-Term Probability Indicator (MTPI)" is a multi-factor model designed to evaluate the medium-term state of a market. By aggregating signals from 20 underlying inputs, it generates a composite score that classifies the market as Bullish, Bearish, or Neutral. This helps traders understand the prevailing market regime and adapt strategies accordingly.
Key Features
- Multi-Input Scoring: Combines up to 20 individual inputs (indicators, conditions, or models) into a single probability-based score.
- Composite Market State: Translates raw input signals into three states: Bullish, Bearish, or Neutral.
- Dynamic Background Coloring: Uses color-coded background shading to visually separate bullish, bearish, and neutral phases.
- MTPI Score: Calculates a final numeric score (ranging from -1 to +1) to quantify the market’s directional bias.
- Dashboard Display: Shows all input signals, their individual states, and the aggregated MTPI score at a glance.
- Medium-Term Focus: Helps identify prevailing conditions that last from several weeks to several months.
Inputs & Settings
MTPI Settings:
- Input Signals (1 to 20): Default: Predefined conditions. Each input evaluates the market from a unique perspective (trend, momentum, volatility, etc.).
- Composite Score Calculation: Default weighting is equal across all inputs.
Color Settings:
- Bullish: Bright green background
- Neutral: Gray/orange background
- Bearish: Bright red background
These colors can be customized as desired.
Calculation Process
Signal Aggregation:
Each input generates a state:
- 1 to 0.1 = Bullish
- 0.1 to -0.1 = Neutral
- -0.1 to -1 = Bearish
Scoring:
The MTPI aggregates these values and calculates an average score.
Classification:
- Bullish: Score > 0
- Bearish: Score < 0
- Neutral: Score ≈ 0
Visualization:
- Background Coloring: Highlights the dominant phase on the chart.
- Dashboard: Displays individual input states, the total MTPI score, and the resulting classification.
How to Use the MTPI
Identifying Market Regimes:
- Bullish: Majority of inputs align positively. Favor long positions or trend-following strategies.
- Bearish: Majority of inputs align negatively. Favor short positions or defensive strategies.
- Neutral: Mixed signals. Caution or range-bound strategies may be preferable.
Transition Detection:
- Changes in background color or the MTPI dashboard (score flipping from positive to negative, or vice versa) indicate potential regime shifts.
Dynamic Dashboard:
- Score: Displays the net sum of all input signals (normalized).
- State: Provides the classification (Bullish, Bearish, Neutral).
- Trend: Visual cues for each input showing the current contribution to the MTPI.
Conclusion
The Medium-Term Probability Indicator (MTPI) consolidates multiple signals into a single, intuitive visualization that helps traders quickly assess the medium-term market environment. Its combination of a multi-input dashboard, composite scoring, and background coloring makes it a powerful decision-support tool.
This script is developed by Jeffrey Timmermans and is designed to complement other analysis methods.
僅限邀請腳本
只有經作者批准的使用者才能訪問此腳本。您需要申請並獲得使用權限。該權限通常在付款後授予。如欲了解更多詳情,請依照以下作者的說明操作,或直接聯絡JeffreyTimmermans。
除非您完全信任其作者並了解腳本的工作原理,否則TradingView不建議您付費或使用腳本。您也可以在我們的社群腳本中找到免費的開源替代方案。
作者的說明
This script is invite-only. Think you deserve access to this indicator? Feel free to contact me.
@JeffreyTimmermans
免責聲明
這些資訊和出版物並不意味著也不構成TradingView提供或認可的金融、投資、交易或其他類型的意見或建議。請在使用條款閱讀更多資訊。