PROTECTED SOURCE SCRIPT
CCI Swing and resistance [zavaUnni]
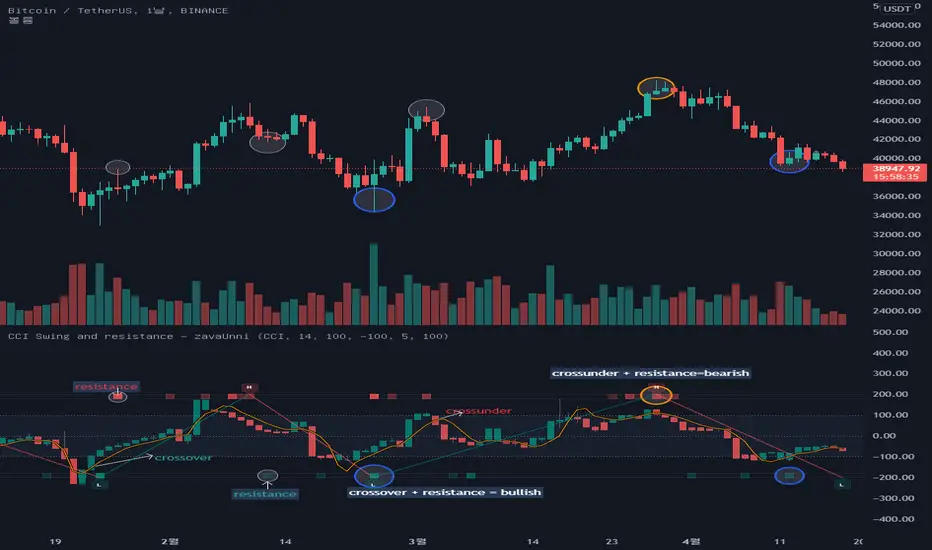
The candles you see on this indicator is the value open price, closing price, high, and low is converted to a selected index value.
Select from selectable settings: rsi , cci , mfi , or stochstic
The default indicator is set to cci .
O_ = ta. cci (open,i_length)
H_ = ta. cci (high,i_length)
L_ = ta. cci (low,i_length)
C_ = ta. cci (close,i_length)
Like the close, open, high, low price, the MA value is converted to the selected index and displayed as a yellow line
short_A = ta. sma (close, short_lenA)
short = ta. cci (short_A,i_length2)
The MA length can be converted from the set value and is defaulted to 5 days.
If C_ is above short, it looks like a teal color, and if C_ is below, it looks like a red color.
-High and low -
When the selected index reaches the oversold value, it finds a high value, and when it reaches the oversold value, it finds a low value.
Oversold and overbought values can be changed in the setting, and the default setting is 100 and -100.
The default setting is recommended unless otherwise noted.
The method of finding the low value is to find the lowest value (var) when the index crosses from 100 to reach -100, until it rises to 100.
The same is true of finding high values.
It was marked with a teal color when going from oversold to oversold, and red color when going down from oversold to oversold.
-os, ob and resistances-
The bar at the top and bottom of the index shows resistance, over-buying, and over-selling values
Over-buying and over-selling values are hidden, so you can change them to be seen if necessary.
1. The volume is large, but if the change rate of candlestic(spred_rate) is not large, resistance has occurred.
2. If thespred_rate is excessively large compared to the volume , oversold or oversold occurs.
Based on the above two basic theories, we created the following formula to derive the strength of the resistance.
Resistance Index = spred_rate / volume
We find the average value of the resistance Index,
If the spred_rate is higher than the predicted value, it is oversold or oversold.
If the spred_rate value is lower than the predicted value, the resistance was derived as the issuance signal.
The larger the deviation from the predicted value, the higher the saturation.
The presence of bright red can be seen as a result of greater resistance.
https://www.tradingview.com/x/BDqwWH3U/
The same goes for over-buying and over-selling prices
The brighter the gray, the more spread without trading volume , and it can be judged that it is not a true bull or a true bear.
https://www.tradingview.com/x/nnWMUXSl/
受保護腳本
此腳本以閉源形式發佈。 不過,您可以自由且不受任何限制地使用它 — 在此處了解更多資訊。
免責聲明
這些資訊和出版物並不意味著也不構成TradingView提供或認可的金融、投資、交易或其他類型的意見或建議。請在使用條款閱讀更多資訊。
免責聲明
這些資訊和出版物並不意味著也不構成TradingView提供或認可的金融、投資、交易或其他類型的意見或建議。請在使用條款閱讀更多資訊。