OPEN-SOURCE SCRIPT
UO_30-50-70
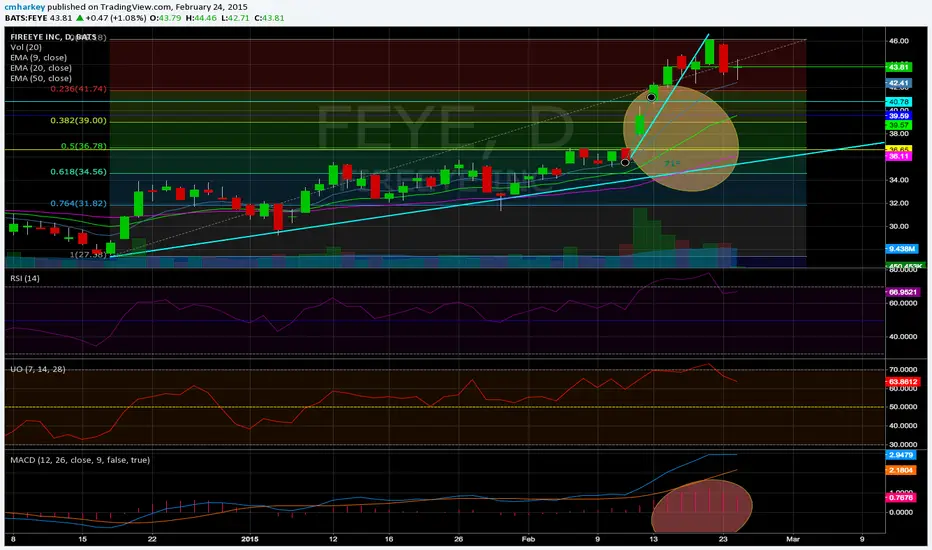
Ultimate Oscillator with bands present at the 30, 50, and 70 pt levels.
Personally use this every time, created a script to hard code these lines so I wouldn't need to redraw them all the time.
Enjoy
Personally use this every time, created a script to hard code these lines so I wouldn't need to redraw them all the time.
Enjoy
開源腳本
本著TradingView的真正精神,此腳本的創建者將其開源,以便交易者可以查看和驗證其功能。向作者致敬!雖然您可以免費使用它,但請記住,重新發佈程式碼必須遵守我們的網站規則。
免責聲明
這些資訊和出版物並不意味著也不構成TradingView提供或認可的金融、投資、交易或其他類型的意見或建議。請在使用條款閱讀更多資訊。
開源腳本
本著TradingView的真正精神,此腳本的創建者將其開源,以便交易者可以查看和驗證其功能。向作者致敬!雖然您可以免費使用它,但請記住,重新發佈程式碼必須遵守我們的網站規則。
免責聲明
這些資訊和出版物並不意味著也不構成TradingView提供或認可的金融、投資、交易或其他類型的意見或建議。請在使用條款閱讀更多資訊。