INVITE-ONLY SCRIPT
Option Trend for Nifty & Bank Nifty (Indian Market)
This is an advanced multi-system trading indicator for TradingView, offering a comprehensive suite of tools for technical analysis and trading decision support[search_files_v2:1].
Main Features
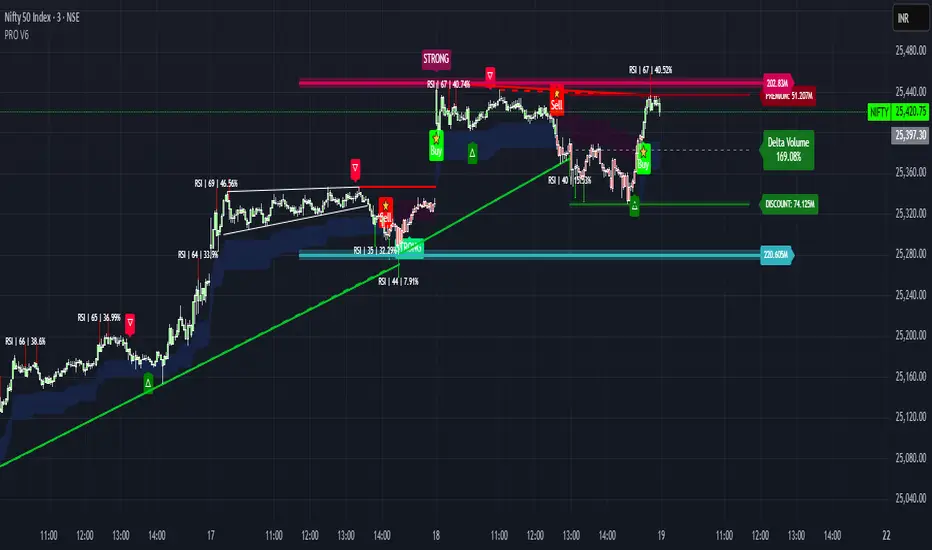
Trendline Detection: Identifies bullish and bearish trendlines automatically using swing highs and lows, with optional labeling of key price structure (Higher Highs, Lower Lows, etc.) and customizable line colors and styles.
Signal & Trend Systems: Includes both a crossover signal system (for buy/sell entries) and a multi-period trend-following system, which uses enhanced moving averages and dynamic trailing levels to adapt to different market conditions.
Supply & Demand Zones: Automatically detects and marks potential supply and demand zones based on pivot structures and ATR buffers, helping spot logical areas for price reaction or reversal.
Support & Resistance: Plots periodic support/resistance and macro (long-term) levels, with user-defined periods and the ability to visualize volume delta for each zone.
Theil-Sen Estimator: Optionally adds a statistical regression channel using the robust Theil-Sen method to identify trend direction and breaks for long-term analysis.
RSI/KDE Analysis: Implements relative strength index (RSI) analysis with kernel density estimation (KDE) to detect pivot points with probability labeling and color-coded signals for high-confidence reversals.
Dashboards & Alerts: Provides multitimeframe dashboards summarizing trend, EMA signals, and momentum across up to five timeframes, plus integrated alerting for all major events (entries, exits, zone breaks, etc.).
Customization & Usability
Extensive input settings for periods, color themes, line widths, and label visibility.
Can display visual cloud bands, trend ribbons, and supply/demand boxes as overlays on price charts for enhanced clarity.
Open-source and for educational use under permissive licensing, not affiliated with TradingView.
This indicator is designed to deliver a full-featured market map, combining price action, trend, support/resistance, and probabilistic signals for discretionary or semi-automated trading.
Main Features
Trendline Detection: Identifies bullish and bearish trendlines automatically using swing highs and lows, with optional labeling of key price structure (Higher Highs, Lower Lows, etc.) and customizable line colors and styles.
Signal & Trend Systems: Includes both a crossover signal system (for buy/sell entries) and a multi-period trend-following system, which uses enhanced moving averages and dynamic trailing levels to adapt to different market conditions.
Supply & Demand Zones: Automatically detects and marks potential supply and demand zones based on pivot structures and ATR buffers, helping spot logical areas for price reaction or reversal.
Support & Resistance: Plots periodic support/resistance and macro (long-term) levels, with user-defined periods and the ability to visualize volume delta for each zone.
Theil-Sen Estimator: Optionally adds a statistical regression channel using the robust Theil-Sen method to identify trend direction and breaks for long-term analysis.
RSI/KDE Analysis: Implements relative strength index (RSI) analysis with kernel density estimation (KDE) to detect pivot points with probability labeling and color-coded signals for high-confidence reversals.
Dashboards & Alerts: Provides multitimeframe dashboards summarizing trend, EMA signals, and momentum across up to five timeframes, plus integrated alerting for all major events (entries, exits, zone breaks, etc.).
Customization & Usability
Extensive input settings for periods, color themes, line widths, and label visibility.
Can display visual cloud bands, trend ribbons, and supply/demand boxes as overlays on price charts for enhanced clarity.
Open-source and for educational use under permissive licensing, not affiliated with TradingView.
This indicator is designed to deliver a full-featured market map, combining price action, trend, support/resistance, and probabilistic signals for discretionary or semi-automated trading.
僅限邀請腳本
僅作者批准的使用者才能訪問此腳本。您需要申請並獲得使用許可,通常需在付款後才能取得。更多詳情,請依照作者以下的指示操作,或直接聯絡balagan93。
TradingView不建議在未完全信任作者並了解其運作方式的情況下購買或使用腳本。您也可以在我們的社群腳本中找到免費的開源替代方案。
作者的說明
Access is provided only to approved users.
Please message me via TradingView with:
Your username
Proof of subscription/payment (if applicable)
Any questions or feedback
Requests without these details may be declined.
免責聲明
這些資訊和出版物並非旨在提供,也不構成TradingView提供或認可的任何形式的財務、投資、交易或其他類型的建議或推薦。請閱讀使用條款以了解更多資訊。