PROTECTED SOURCE SCRIPT
已更新 Gabriel's RSI ICHIMOKU CLOUD
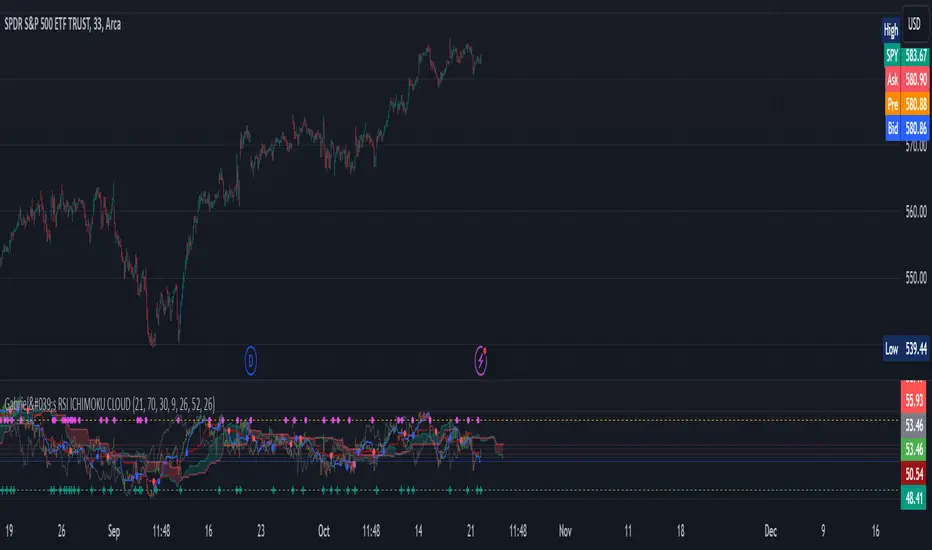
The RSI Ichimoku Cloud combines the strengths of the Relative Strength Index (RSI) with the Ichimoku Cloud, offering a robust visualization of momentum and trend signals. This indicator helps traders identify potential trend reversals and key support/resistance levels by blending RSI with the Ichimoku Cloud components.
Key Features:
RSI Component:
Uses a customizable RSI length (default: 21) to detect overbought and oversold conditions.
Upper and Lower Bands (70 and 30) are plotted as dashed lines, highlighting critical zones of strength and weakness.
Bullish (green) and Bearish (red) cross signals are provided when RSI crosses key levels.
Ichimoku Cloud:
Conversion Line (Tenkan Sen): A 9-period Donchian channel (default), representing short-term price movements. Plotted in blue.
Base Line (Kijun Sen): A 26-period Donchian channel (default), representing mid-term price movements. Plotted in red.
Leading Span A (Senkou Span A): The average of the Conversion Line and Base Line, projected forward (displacement: 26). Plotted in green with transparency.
Leading Span B (Senkou Span B): A 52-period Donchian channel (default), projected forward (displacement: 26). Plotted in red with transparency.
The cloud fill between Senkou Span A and B changes color based on bullish (green) or bearish (red) cloud conditions.
Candlestick Overlay:
The indicator uses RSI values to color-code candlesticks. Bullish candles (RSI > Conversion Line) are green, and bearish candles (RSI < Conversion Line) are red.
Signal Crossovers:
RSI-Based Signals: Bullish and Bearish RSI crossovers with the Base Line trigger visual markers.
Ichimoku Signals: Bullish and Bearish crossovers between the Conversion Line and Base Line provide additional trade signals.
Alerts:
Alerts are triggered based on crossovers, allowing traders to set notifications for key trend changes.
This indicator is ideal for traders looking for a powerful blend of momentum (RSI) and trend-following (Ichimoku) tools in one place, with customizable settings for precise trade entry and exit signals.
發行說明
I changed the coloring a bit to make it easier to see.發行說明
I added to help the trackprice on the Ichimoku to help RSI out, they act as key support resistances for the RSI candles. 發行說明
I added pivot-based divergences just in case.發行說明
I have added a VWAP Smoothing option as well as changed the RSI candles to use the OHLC source. This means High price data is used for the wick high, lows for wick lows, open for opens, and the RSI candle close uses the traditional close price data.受保護腳本
此腳本以閉源形式發佈。 不過,您可以自由使用,沒有任何限制 — 點擊此處了解更多。
Gabriel Amadeus
The Real World - Stocks Campus:
Stocks, Options, Futures, Forex, Crypto, this is what we trade.
Learn profitable trading systems or build your own, just like I did.
jointherealworld.com/?a=f7jkjpg8kh
The Real World - Stocks Campus:
Stocks, Options, Futures, Forex, Crypto, this is what we trade.
Learn profitable trading systems or build your own, just like I did.
jointherealworld.com/?a=f7jkjpg8kh
免責聲明
這些資訊和出版物並非旨在提供,也不構成TradingView提供或認可的任何形式的財務、投資、交易或其他類型的建議或推薦。請閱讀使用條款以了解更多資訊。
受保護腳本
此腳本以閉源形式發佈。 不過,您可以自由使用,沒有任何限制 — 點擊此處了解更多。
Gabriel Amadeus
The Real World - Stocks Campus:
Stocks, Options, Futures, Forex, Crypto, this is what we trade.
Learn profitable trading systems or build your own, just like I did.
jointherealworld.com/?a=f7jkjpg8kh
The Real World - Stocks Campus:
Stocks, Options, Futures, Forex, Crypto, this is what we trade.
Learn profitable trading systems or build your own, just like I did.
jointherealworld.com/?a=f7jkjpg8kh
免責聲明
這些資訊和出版物並非旨在提供,也不構成TradingView提供或認可的任何形式的財務、投資、交易或其他類型的建議或推薦。請閱讀使用條款以了解更多資訊。