PROTECTED SOURCE SCRIPT
已更新 Multi-TimeFrame RDX++ [@TradersVenue]

// release: EMA Cross++ [2020.07.20] v49
// Author : Prasuna.Barik
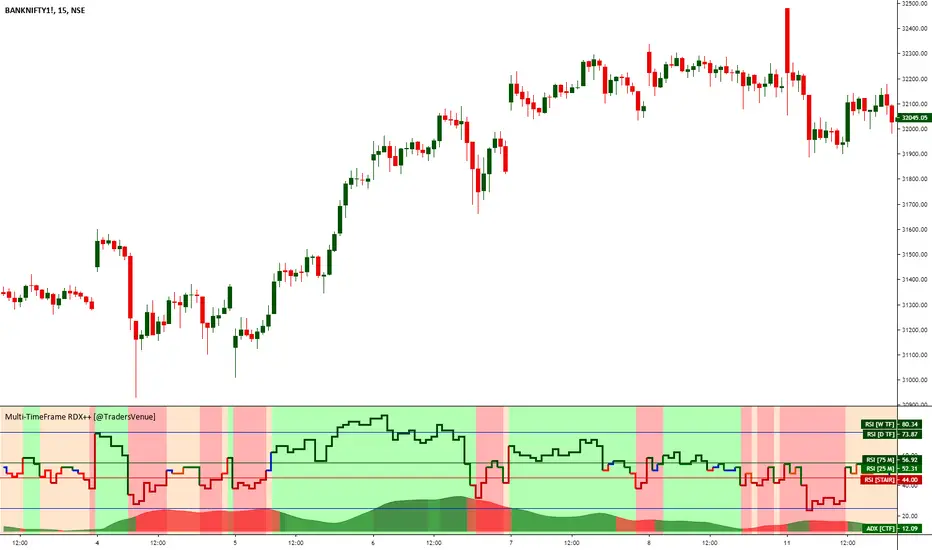
// This is multi timeframe RSI indicator which displays RSI value of 15/25/75/D/W/M timeframes in single window.
// One can select or deselect individual RSI's, choose RSI length of default RSI, length of slow/fast RSI.
// Current RSI indicator considers below scenarios to be bullish 1) RSI > iRSIBuyLvl 2) Smaller TF RSI > Larger TF RSI
// Current RSI indicator considers below scenarios to be bearish 1) RSI < iRSIBuyLvl 2) Smaller TF RSI < Larger TF RSI
// Background of the indicator turns green when RSI trades above iRSIBuyLvl, turns red when RSI trades below iRSISellLvl else orage
// If SlowRSI > SlowRSI[1] then it indicates EMA(RSI(14), LEN) is in a upward slope i.e. its bullish
// Along with RSI it displayes ADX as well. So one may go through the settings and enable or disable display of DI and ADX lines.
// Few UI/UX customizations in chart, like changing line width, transparency, BG Color is provisioned for enhanced viewability
發行說明
Changed RSI to RSIStairs version which is required as part of the VSA setup. All other logics and indicator behavior remains as is. Many users were requesting for this. Now its made available to you. So VSA indicator subscribers can use it now.受保護腳本
此腳本以閉源形式發佈。 不過,您可以自由使用,沒有任何限制 — 點擊此處了解更多。
I am reachable on below social handles.
EMail_ID:- prasuna.barik@pbfin.in
Telegram: t.me/PBFin_222
Twitter: twitter.com/PB_Fin
Indicator access process given here tinyurl.com/VSASetup. Follow it for details.
EMail_ID:- prasuna.barik@pbfin.in
Telegram: t.me/PBFin_222
Twitter: twitter.com/PB_Fin
Indicator access process given here tinyurl.com/VSASetup. Follow it for details.
免責聲明
這些資訊和出版物並非旨在提供,也不構成TradingView提供或認可的任何形式的財務、投資、交易或其他類型的建議或推薦。請閱讀使用條款以了解更多資訊。
受保護腳本
此腳本以閉源形式發佈。 不過,您可以自由使用,沒有任何限制 — 點擊此處了解更多。
I am reachable on below social handles.
EMail_ID:- prasuna.barik@pbfin.in
Telegram: t.me/PBFin_222
Twitter: twitter.com/PB_Fin
Indicator access process given here tinyurl.com/VSASetup. Follow it for details.
EMail_ID:- prasuna.barik@pbfin.in
Telegram: t.me/PBFin_222
Twitter: twitter.com/PB_Fin
Indicator access process given here tinyurl.com/VSASetup. Follow it for details.
免責聲明
這些資訊和出版物並非旨在提供,也不構成TradingView提供或認可的任何形式的財務、投資、交易或其他類型的建議或推薦。請閱讀使用條款以了解更多資訊。