INVITE-ONLY SCRIPT
已更新 [ssabu] TT (Trading Time)

✅ TT(Trading Time)
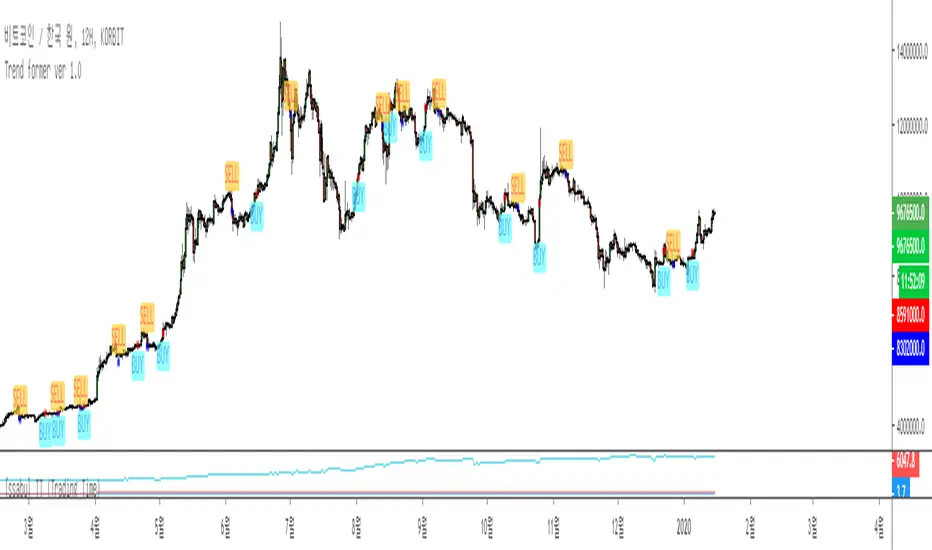
The supplementary indicators are based on 12-hour pay.
Graph of seed change when bought at market price and sold at closing price
When we bought at the closing price and sold at the market
It is a supplementary indicator that compares the seed change graph when it is in the same period.
The cryptocurrency market is open 24 hours, but there's definitely a time for more upside. (Not 100%, very high probability)
It is a supplementary indicator that provides back data about it.
Red seed change graph shows Johnsbury's fund change
The other two graphs, light green and blue, are the difference in the seeding changes between the different buy and sell prices at the market price and closing price.
There is a very high probability of maintaining a much higher seed in more grass green stocks.
What time of day is the seed change graph that you bought and sold at what time?
The answer is in the indicator.
If you know the time, whatever trading method and algorithm you use will increase your winnings and profits.
(These secondary indicators are designed to operate only on 30 minute, 1 hour, 2 hour, 3 hour, 4 hour, 6 hour, 12 hour rods.)
해당 보조지표는 12시간봉 기준으로
싯가에 사서 종가에 팔았을 때의 시드변화 그래프와
종가에 사서 싯가에 팔았을 때의 시드변화 그래프와
같은 기간에 존버 했을 시에 시드변화 그래프를 비교해주는 보조지표입니다.
암호화폐 시장은 24시간 열려있지만 분명히 상승구간이 더 많이 나오는 시간이 정해져 있습니다. (100%는 아니고 굉장히 높은 확률적으로)
그에 대한 백데이터를 제공해주는 보조지표 입니다.
빨간색 시드변화 그래프는 존버시의 자금변화
연두색과 파란색의 다른 두 그래프는 싯가와 종가의 다른 매수와 매도의 시드변화 차이입니다.
굉장히 높은 확률로 연두색이 많은 종목에서 훨씬 더 높은 시드를 유지해주고 있습니다.
연두색은 어떤 시간에 매수하여 어떤 시간에 매도한 시드변화 그래프일까요?
지표 안에 답이 나와있습니다.
그 시간을 알 수 있다면 당신은 어떤 매매법과 알고리즘을 사용하던 당신의 매매는 승률과 손익비가 올라가게 될 것 입니다.
(해당 보조지표는 30분, 1시간, 2시간, 3시간, 4시간, 6시간, 12시간 봉에서만 동작하도록 설계되어 있습니다.)
發行說明
:A date setting feature has been added to this metric.
해당 지표에 날짜설정 기능이 추가 되었습니다.
【 트레이딩뷰 매니아 】
cafe.naver.com/tradingviewmania
【 트레이딩 시스템 】
tradingviewmania-menu.oopy.io/
【 카톡 】
bit.ly/싸부_문의1
【 텔레그램 】
bit.ly/싸부텔레
cafe.naver.com/tradingviewmania
【 트레이딩 시스템 】
tradingviewmania-menu.oopy.io/
【 카톡 】
bit.ly/싸부_문의1
【 텔레그램 】
bit.ly/싸부텔레
免責聲明
這些資訊和出版物並不意味著也不構成TradingView提供或認可的金融、投資、交易或其他類型的意見或建議。請在使用條款閱讀更多資訊。