INVITE-ONLY SCRIPT
已更新 Ekambit Volume Strength Index (EVSI)
Ekambit Volume Strength Index (EVSI) is an innovative volume strength oscillator, which makes use of long-term historical volume strength as well as real-time volume strength in an easy to use format.
We at Ekambit Technologies use it daily, together with ESI indicator, with consistent success in the Indian and US markets.
This indicator is effective for intraday timeframes as we have backtested as well as deployed on the live market.
Usage:
1) Green & above mid-zone & rising: uptrend
2) Green & falling from high-zone: uptrend reversal
3) Red & below mid-zone & falling: downtrend
4) Red & rising from low-zone: downtrend reversal
5) Blue: transition middle-zone (wait to enter, or exit on opportunity)
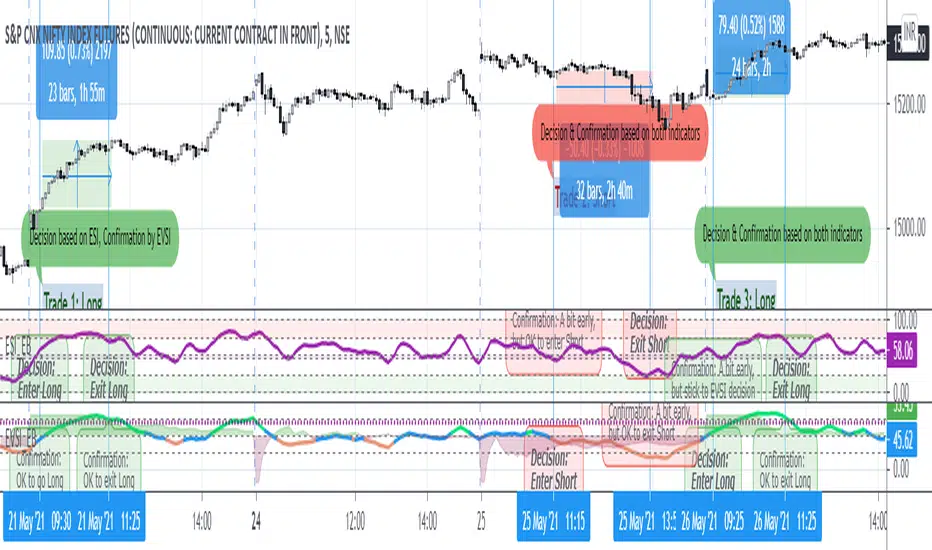
For greater conviction before entering a trade, enable the "Show Trend" option, which compares recent volume strength with long-term historical volume strength.
For the above example,
* The purple dotted line (around 65) shows the long term historical volume trend strength.
* The green shaded area indicates that current volume trend strength is around 5% stronger than historical, which should provide greater conviction to the direction shown by EVSI indicator. This delta (recent minus historical) is shown with a base of 50, to align with the middle line of EVSI and provide you with an easy visually perceptible output.
Learning:
Just like price has memory, volume has memory. Volume indicates the collective outcome of all market participants. A larger number of participants makes it easier to predict the volume trend in a probabilistic manner.
Hence Index Futures like ES1!,
ES1!,  NQ1!,
NQ1!,  NIFTY1! and
  BANKNIFTY1! are better suited for volume analysis than individual stocks which can be less liquid, with price more easily influenced by a large buyer or seller.
For Futures which trade almost 24x7, it's better to choose the high volume time periods i.e. when local Equity market is Open, rather than the overnight illiquid time periods.
We at Ekambit Technologies use it daily, together with ESI indicator, with consistent success in the Indian and US markets.
This indicator is effective for intraday timeframes as we have backtested as well as deployed on the live market.
Usage:
1) Green & above mid-zone & rising: uptrend
2) Green & falling from high-zone: uptrend reversal
3) Red & below mid-zone & falling: downtrend
4) Red & rising from low-zone: downtrend reversal
5) Blue: transition middle-zone (wait to enter, or exit on opportunity)
For greater conviction before entering a trade, enable the "Show Trend" option, which compares recent volume strength with long-term historical volume strength.
For the above example,
* The purple dotted line (around 65) shows the long term historical volume trend strength.
* The green shaded area indicates that current volume trend strength is around 5% stronger than historical, which should provide greater conviction to the direction shown by EVSI indicator. This delta (recent minus historical) is shown with a base of 50, to align with the middle line of EVSI and provide you with an easy visually perceptible output.
Learning:
Just like price has memory, volume has memory. Volume indicates the collective outcome of all market participants. A larger number of participants makes it easier to predict the volume trend in a probabilistic manner.
Hence Index Futures like
For Futures which trade almost 24x7, it's better to choose the high volume time periods i.e. when local Equity market is Open, rather than the overnight illiquid time periods.
發行說明
- Improved EVSI calculation
- Showcase latest example from 28-May-2021
- Show EVSI usage together with ESI indicator, for a stronger conviction for entering and exiting trades
僅限邀請腳本
僅作者批准的使用者才能訪問此腳本。您需要申請並獲得使用許可,通常需在付款後才能取得。更多詳情,請依照作者以下的指示操作,或直接聯絡ekambit。
TradingView不建議在未完全信任作者並了解其運作方式的情況下購買或使用腳本。您也可以在我們的社群腳本中找到免費的開源替代方案。
作者的說明
Kindly use the link below to obtain 7-days free access to this indicator, and get more information about its usage and configuration:
https://secure.ekambit.com/evsi/
免責聲明
這些資訊和出版物並非旨在提供,也不構成TradingView提供或認可的任何形式的財務、投資、交易或其他類型的建議或推薦。請閱讀使用條款以了解更多資訊。