PROTECTED SOURCE SCRIPT
MACD on Volume (Signal)
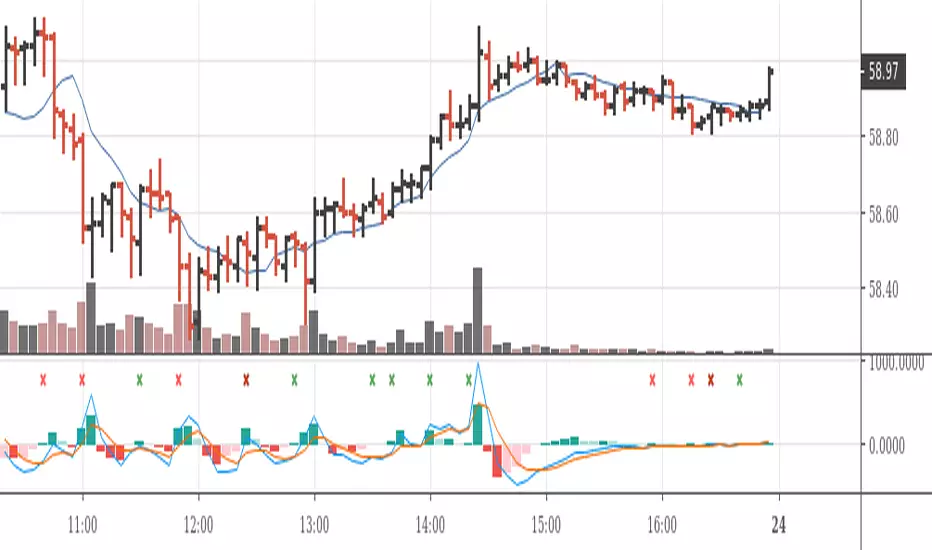
Volume-Price-based 5-min-Chart Trading
Pull up a 5-min chart of your favourite commodity future and stay inside regular trading hours, but show all of globex trading, too.
You will want to base your trading off the 5-min chart on volume and price.
Volume Logic:
The (positive) histogram of your MACD on Pro Rata Volume* indicates market phases with valuable participation. Participate in those phases. Put a horizontal ray on your volume indicator to indicate slow and less than slow volume phases. Stay away from those market phases.
*) Pro Rata Volume = Actual Volume * 300 / elapsed seconds
(Do the platform test. Can you add this indicator to your platform?)
受保護腳本
此腳本以閉源形式發佈。 不過,您可以自由使用,沒有任何限制 — 點擊此處了解更多。
免責聲明
這些資訊和出版物並非旨在提供,也不構成TradingView提供或認可的任何形式的財務、投資、交易或其他類型的建議或推薦。請閱讀使用條款以了解更多資訊。
免責聲明
這些資訊和出版物並非旨在提供,也不構成TradingView提供或認可的任何形式的財務、投資、交易或其他類型的建議或推薦。請閱讀使用條款以了解更多資訊。